Albuquerque Real Estate Trends: November 2025 Market Update (Slow but Steady)

Albuquerque Real Estate Trends: November 2025 Market Update (Slow but Steady)

Albuquerque Real Estate Trends: November 2025 Market Update (Slow but Steady)

November 2025 was one of the slowest months we’ve seen in a while for Albuquerque home sales. Closings dropped, prices stayed basically flat, and inventory inched up but remains below pre-2020 levels. Here’s what the data really says and what it means if you’re thinking about buying or selling in 2026.

  • Closed sales in November fell to 638, down about 12% from November 2024 and almost 200 fewer than in October.
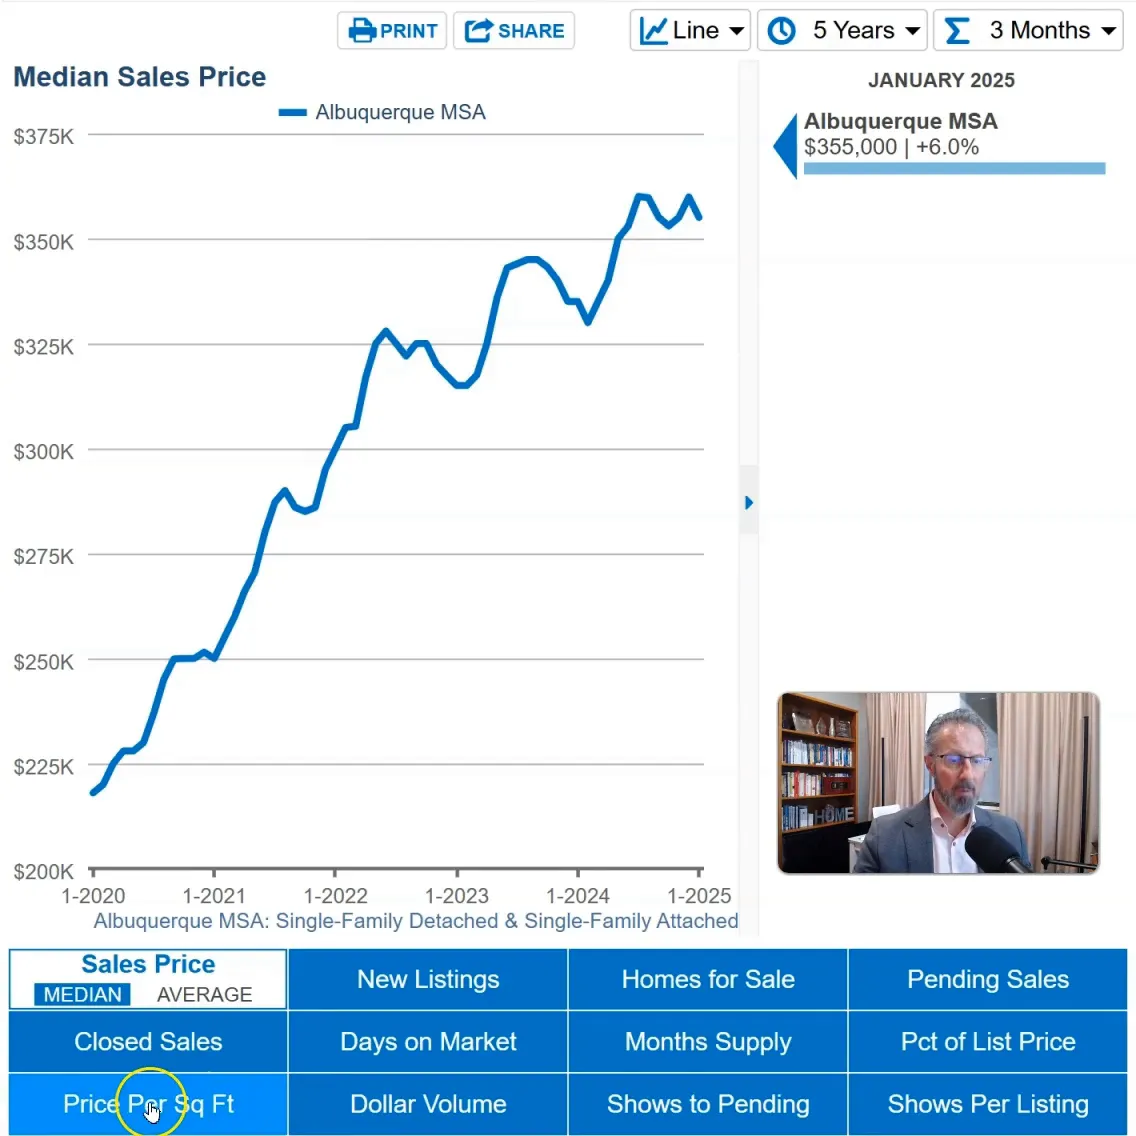
  • Prices are flat to slightly up for 2025 overall: median at $355,000 across all home sales in November, 1.4% lower than November 2024.
  • We expect annual appreciation to be ~2–3% higher year-over-year for the full year.
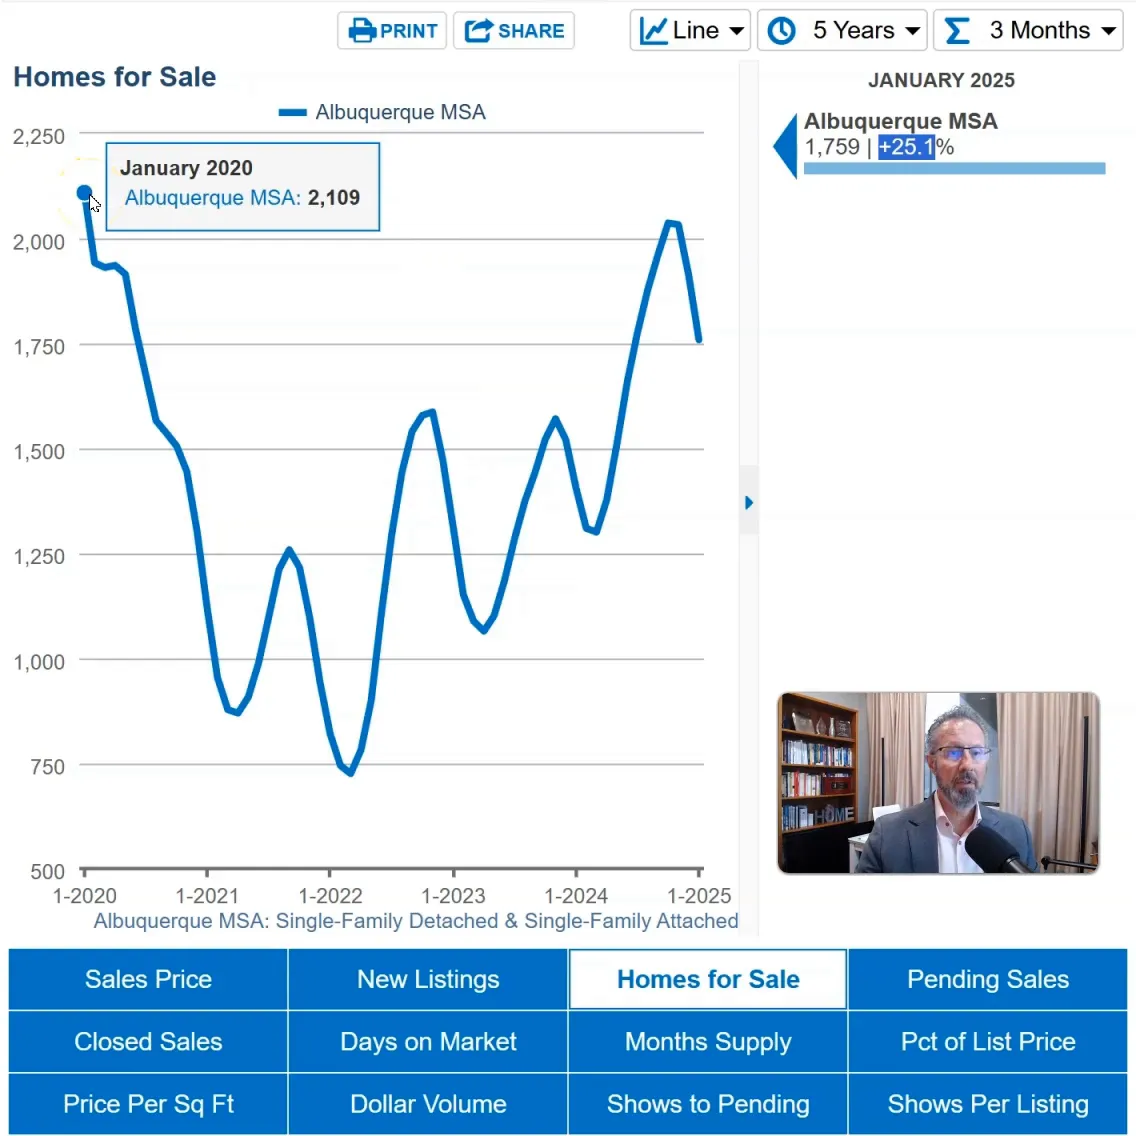
  • Inventory sits around 2,086 homes, up ~5% from last year but still slightly below 2019 levels at this time of year.
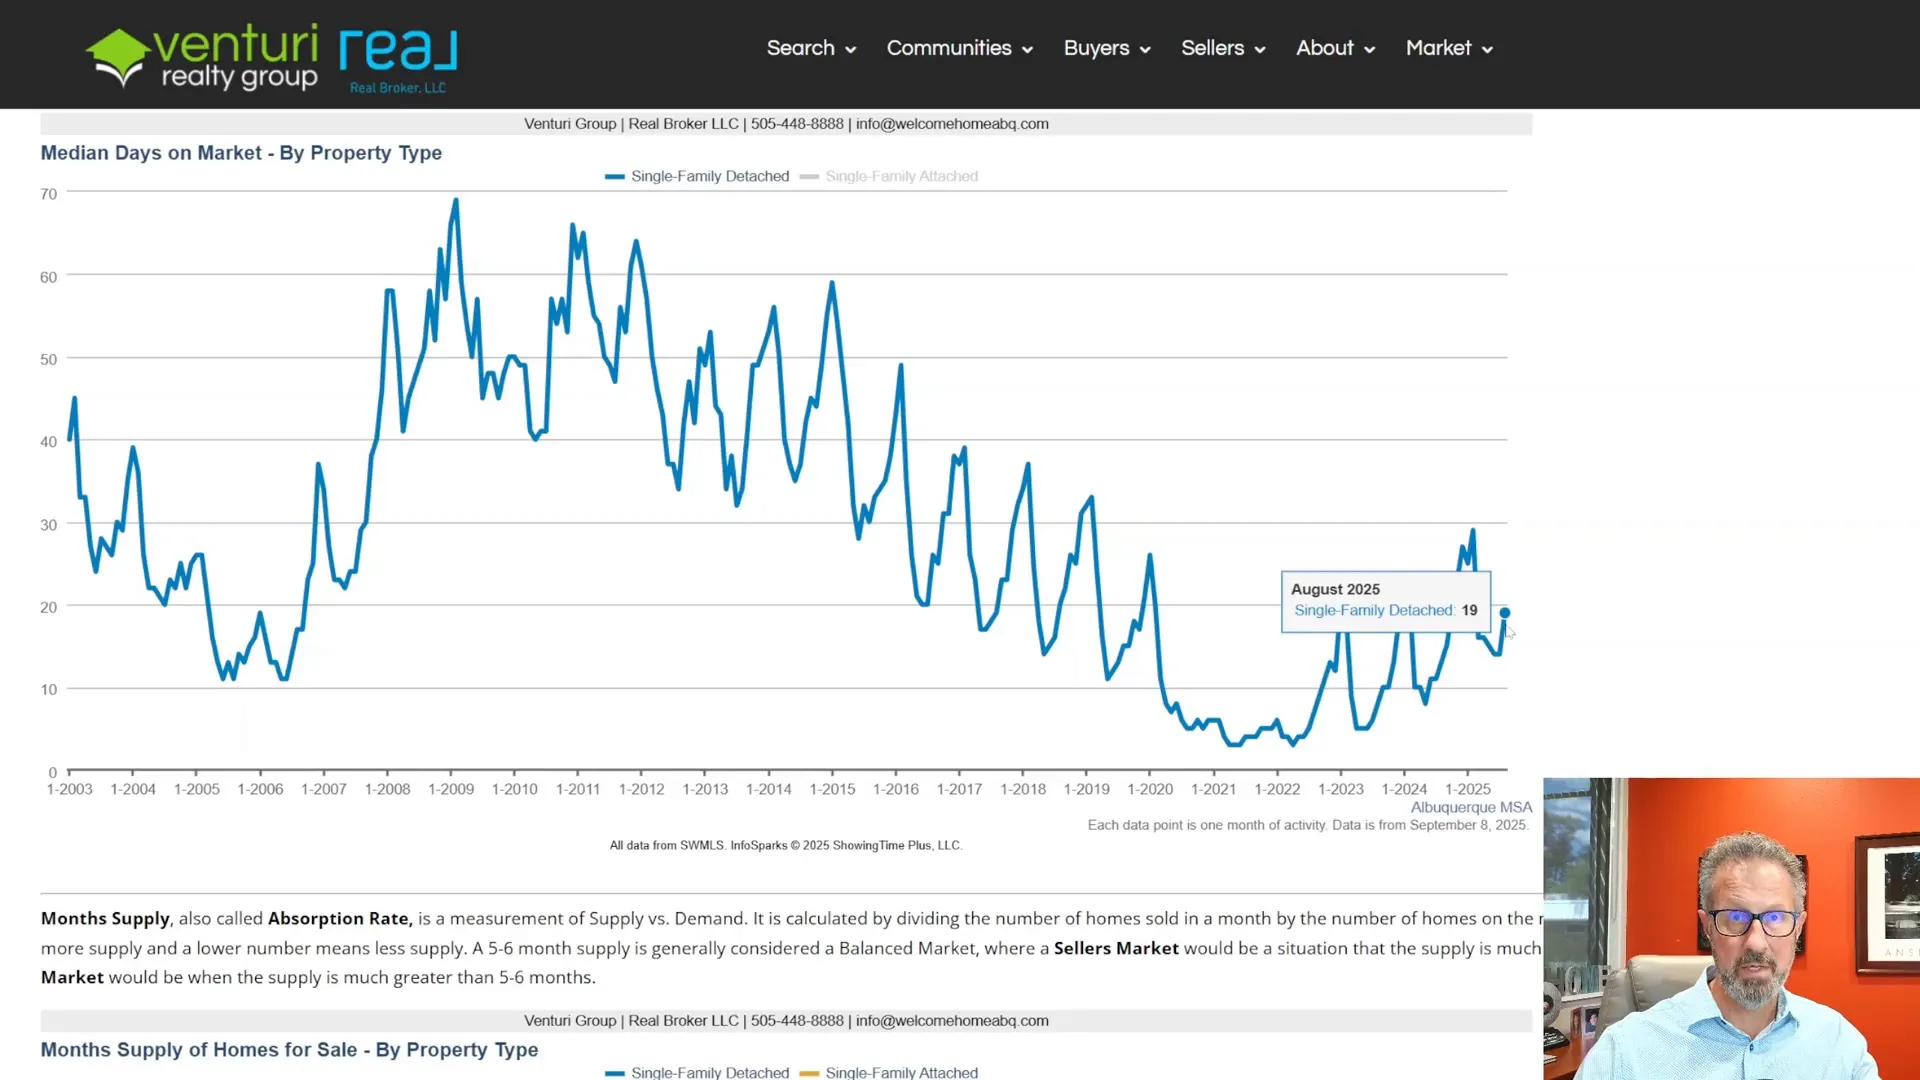
  • Days on Market has drifted back toward a “normal” pace at about 49 days, similar to 2018–2019.
  • National forecasts call for a ~14% jump in home sales next year, which could mean roughly 1,400 more closings in the Albuquerque area if that plays out locally. :

Market Snapshot – November 2025

November was sluggish. Only 638 single-family homes (attached and detached) closed in the Albuquerque area, about 190 fewer than in October and roughly 12% below November 2024’s 728 closings. Year-to-date, though, total 2025 sales are still slightly ahead of 2024, so November looks more like a soft patch than a collapse.

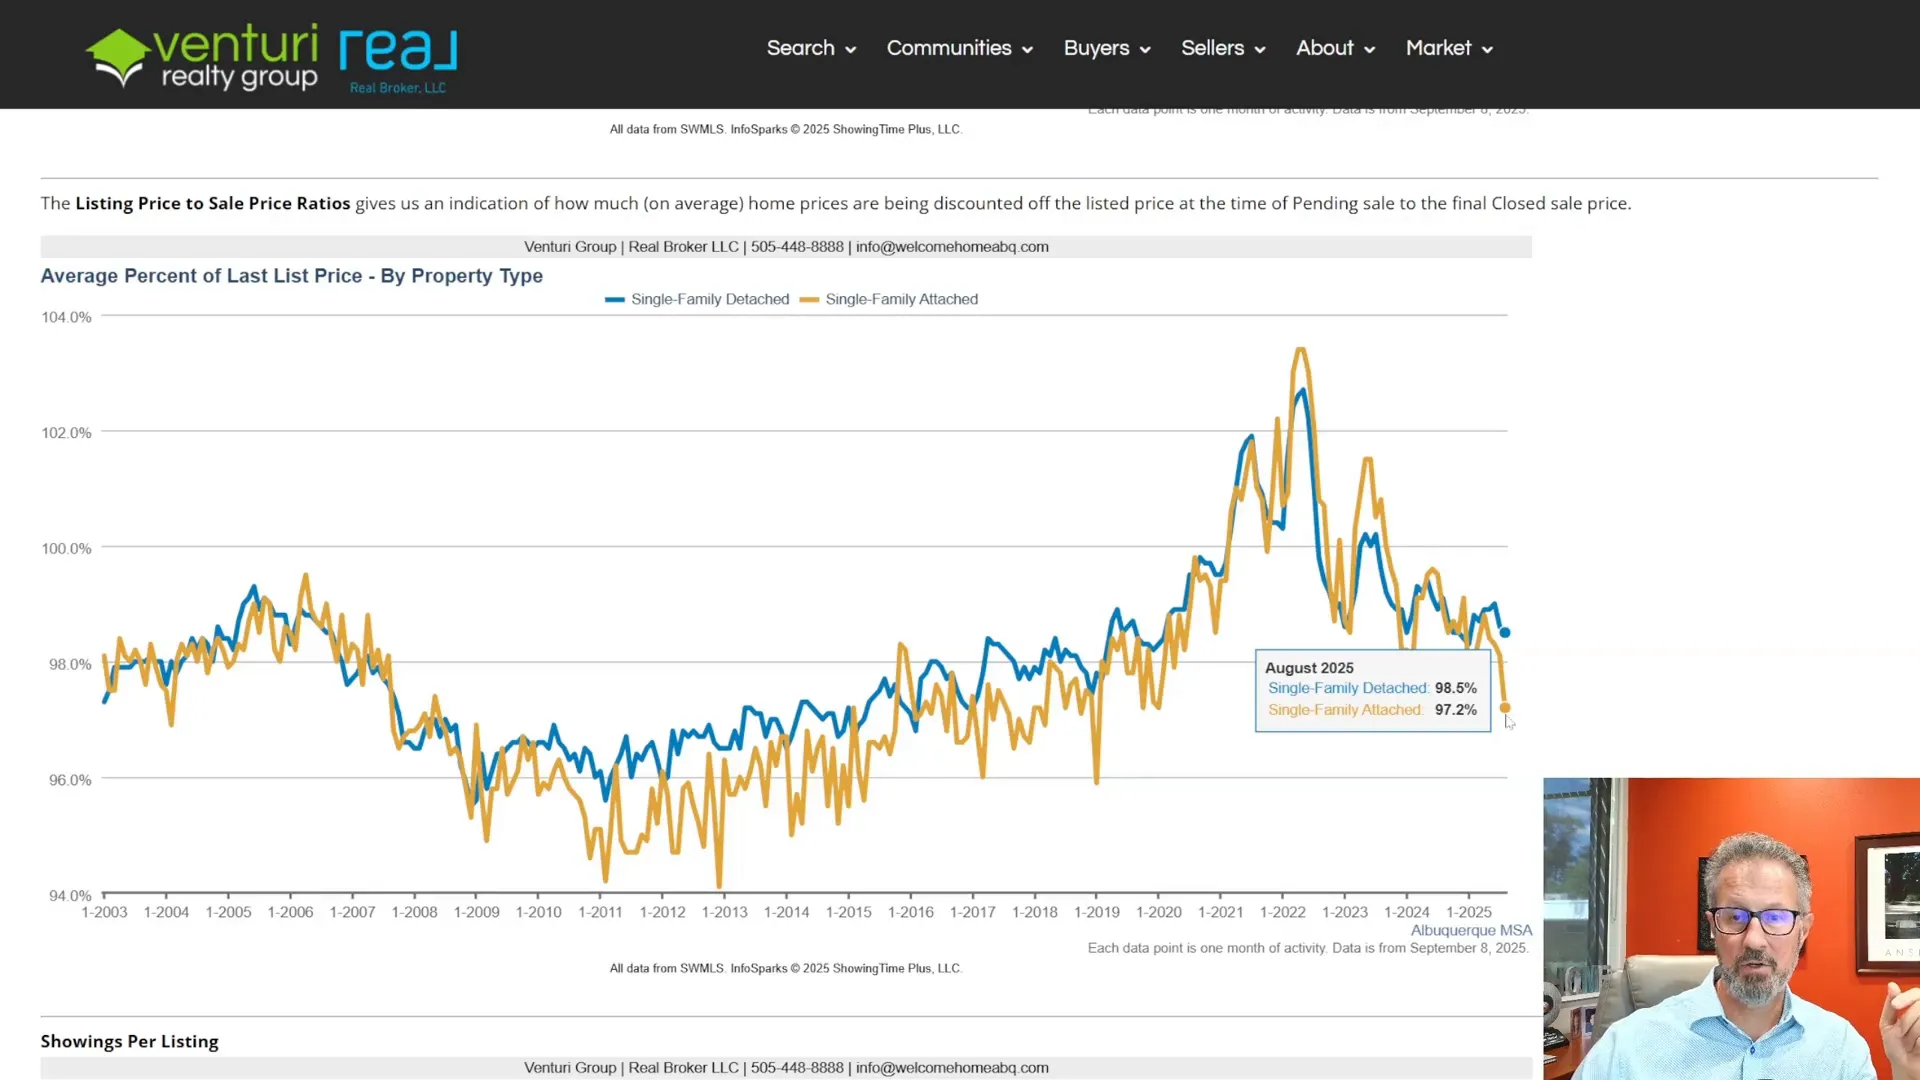
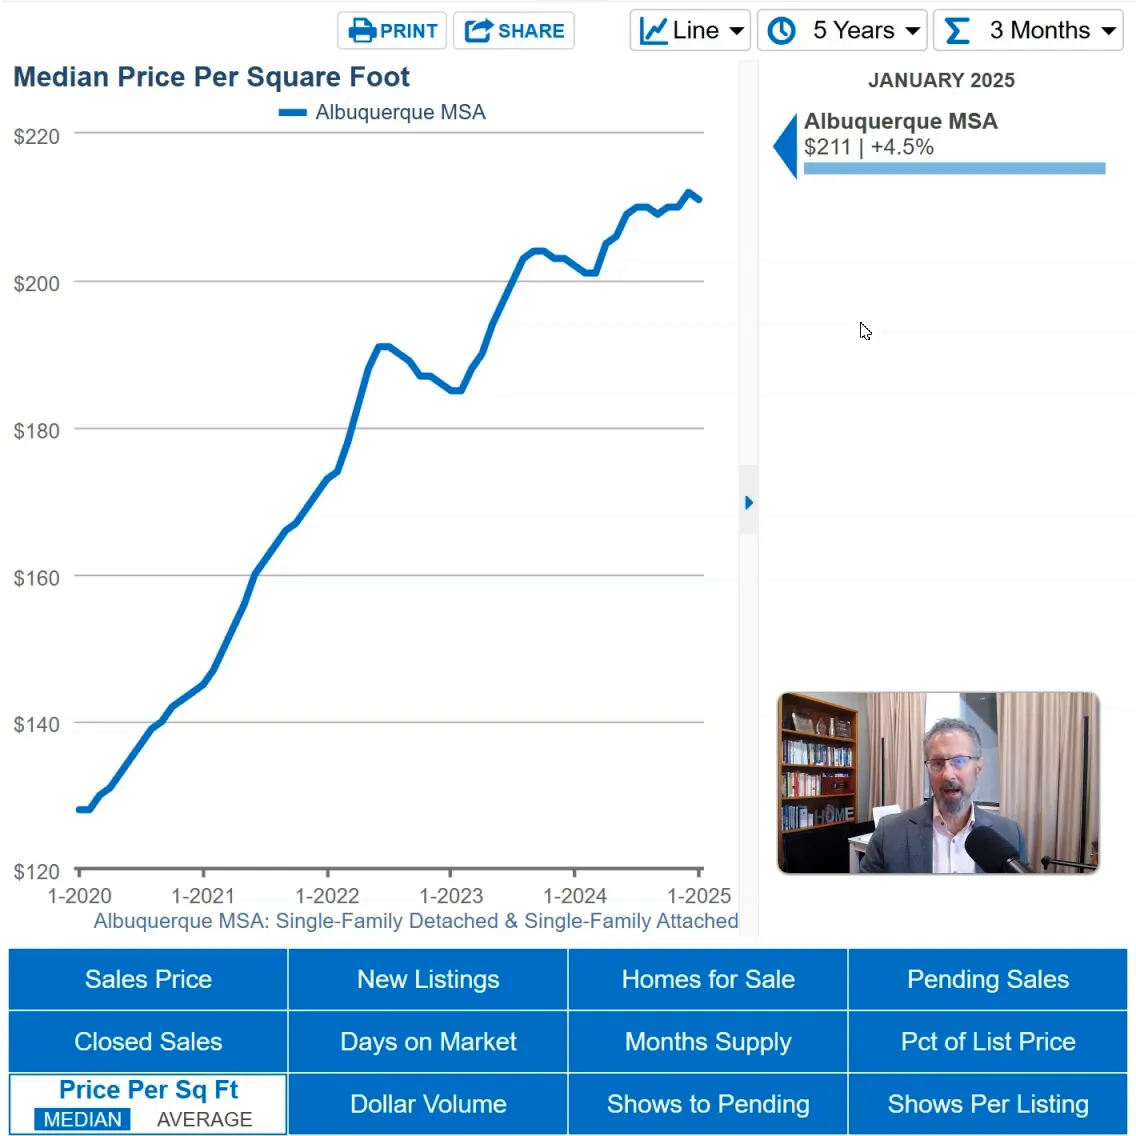
On the pricing side, the median sales price came in at $355,000 in November, down 1.4% compared to November a year ago and off from October’s $362,750. But when you zoom out beyond a single month, 2025 still looks like a modestly positive year for prices, with overall appreciation tracking in the 2–3% range and price-per-square-foot for November running exactly flat versus last year.

Why it matters

  • Buyers: You’re not fighting runaway price gains. A flat-to-modestly-up market gives you more room to negotiate and more time to think.
  • Sellers: You can still sell at or near the peak values achieved over the last couple of years, but you can’t count on multiple offers day one. Strategy and pricing matter again.
  • Investors: A boring market is usually a healthy market. Small, steady gains are more sustainable than boom-and-bust cycles.
Weekly Altos-style snapshot: inventory dipped seasonally into late November, buyer activity pulled back over Thanksgiving, and showings are now ticking back up as we move through December.

Foot Traffic & Buyer Demand: Holiday Dip, Normal Pattern

One of the best forward-looking indicators we watch is showing activity—how many buyers are actually out touring homes each week. In 2025, showings slid sharply at the end of November, right on cue with the Thanksgiving holiday. That same late-November drop shows up in every recent year on the chart. After the holiday, activity starts to recover into December, then takes another pause around Christmas.

Overall, 2025 has fewer buyers out shopping than some of the boom years, but the showing trend looks very similar to 2024. Fewer house hunters, yes. But not a ghost town.

Why it matters

  • If you’re selling: Expect fewer showings over the holidays. That doesn’t mean your home is “broken” – it’s just the calendar.
  • If you’re buying: This is a sneaky window of opportunity. With fewer competing buyers in November and December, you may have more negotiating room.

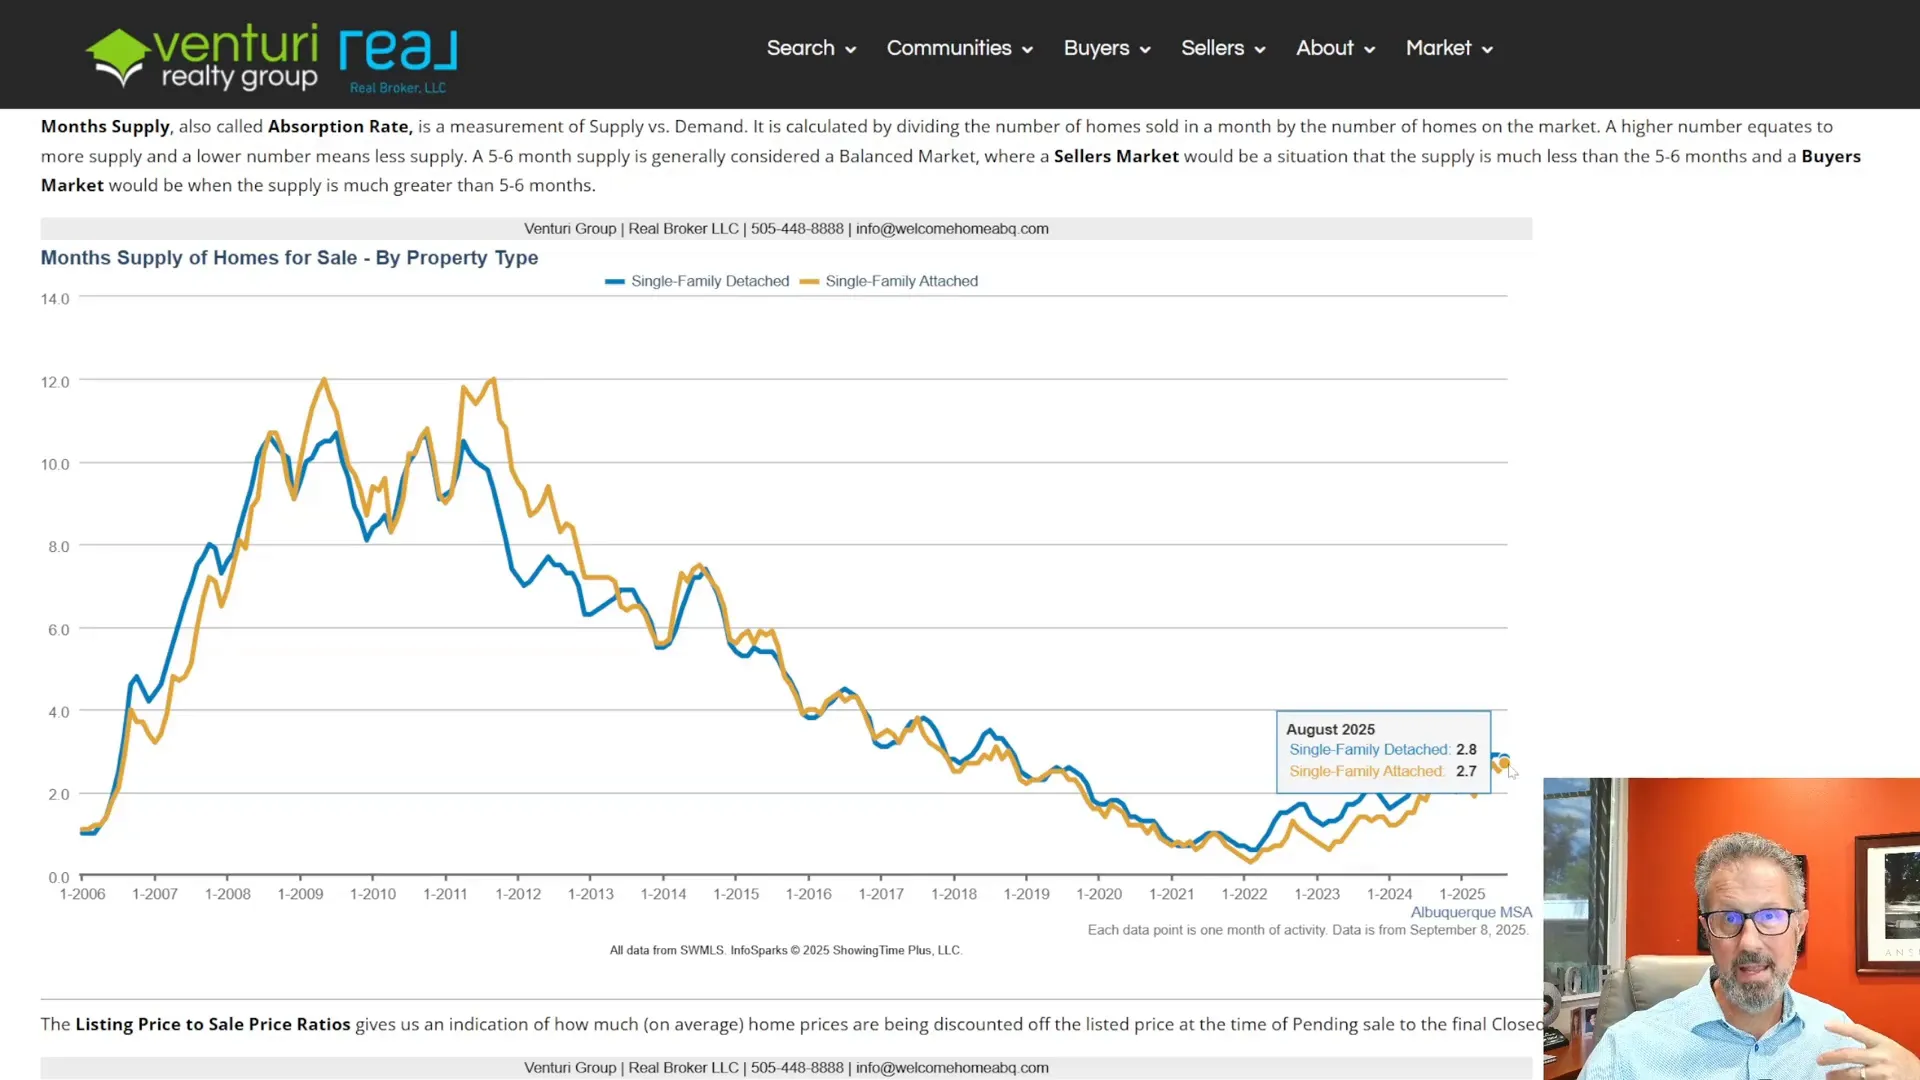
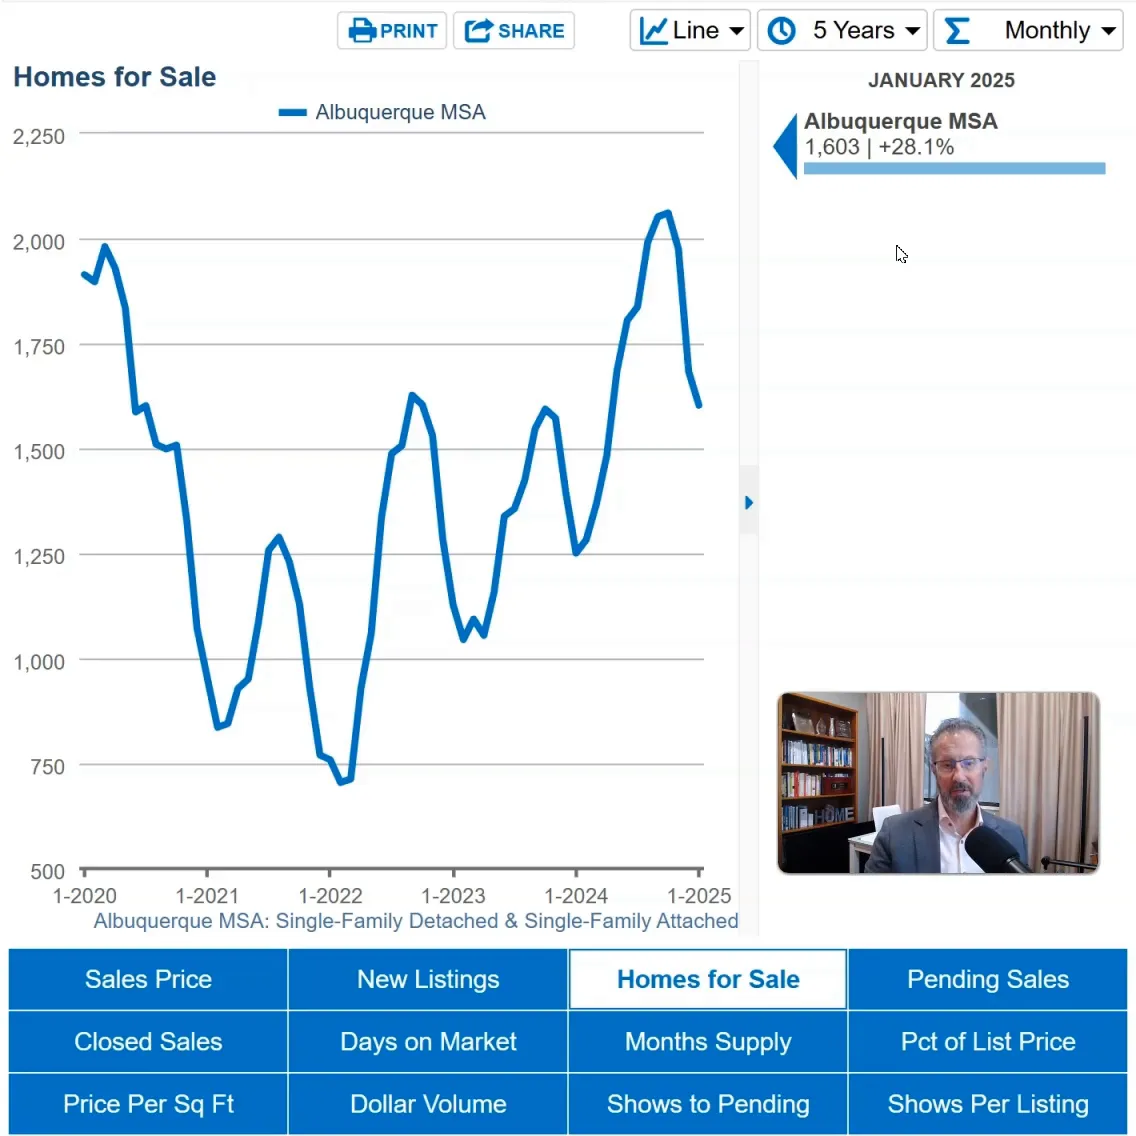
Inventory: Up From Last Year, Still Below 2019

Active listings for November clocked in at about 2,086 homes on the market. That’s roughly 4.9% more inventory than one year ago and about 300 fewer homes than we saw in October as sellers started to pull back heading into the holidays.

When we look at a longer weekly view back to 2019, Albuquerque has more homes on the market than in the tight-supply years from 2020 through 2024, but still fewer than in 2019, when there were about 2,150 active listings at the same time of year. Many large markets nationally have already moved above their 2019 inventory levels, but Albuquerque remains a bit undersupplied by that benchmark.

Why it matters

  • Still a supply shortage: We have more homes to choose from than during the extreme pandemic squeeze, but not a glut.
  • Pricing support: Slightly tight inventory helps keep prices from falling even when demand is soft.
  • Strategy for sellers: With fewer new listings hitting the market through January and early February, a well-prepared listing can stand out.
Long-term Albuquerque price and inventory trends: strong post-2020 appreciation followed by a shift into low single-digit annual growth and modestly higher inventory through 2024–2025.

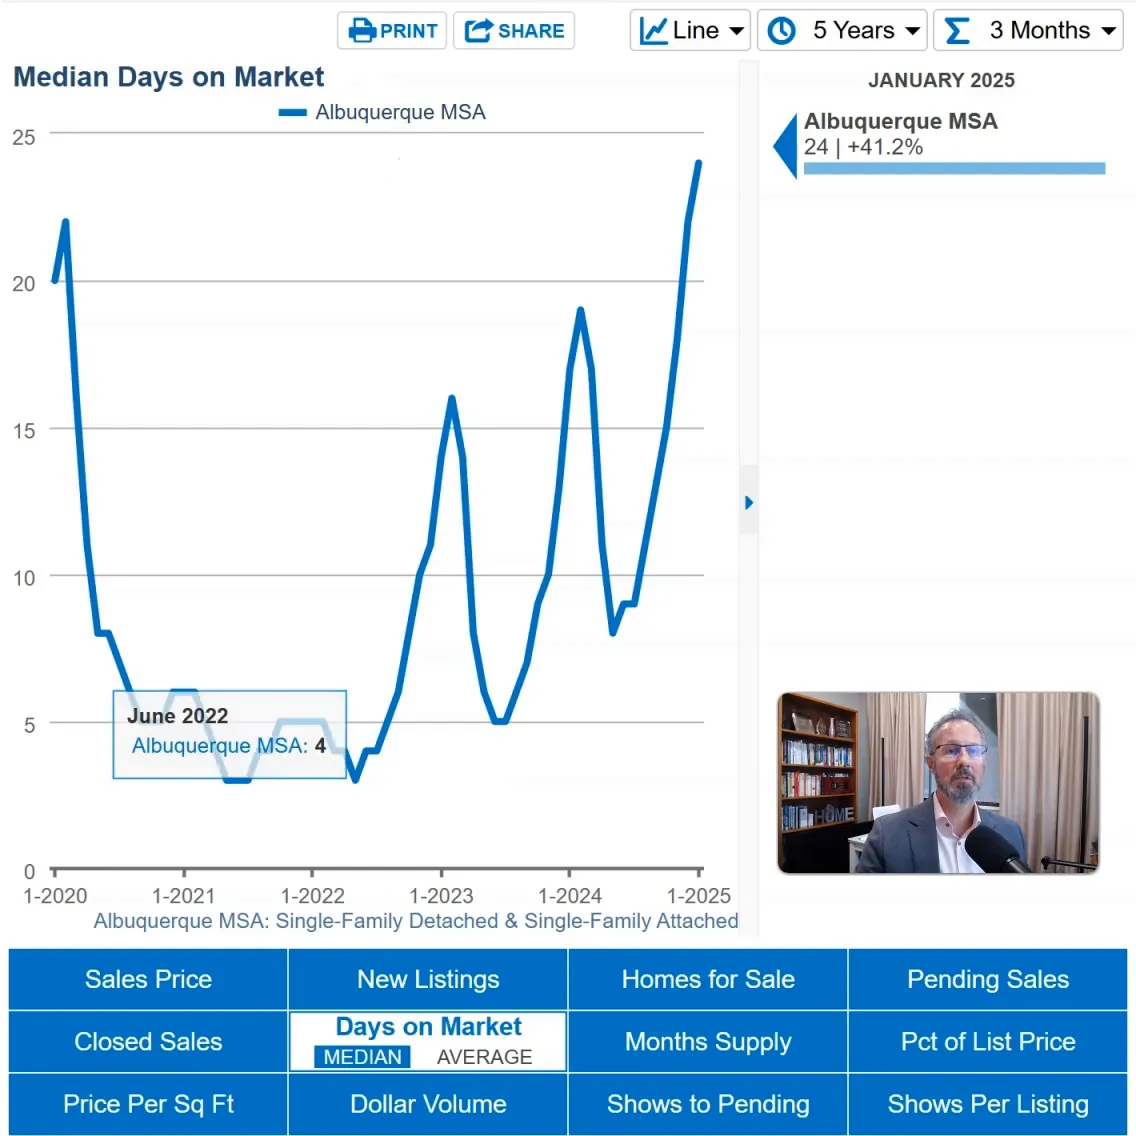
Days on Market: Back to a “Normal” Pace

Average Days on Market (DOM) for homes that actually sold in November landed at 49 days. That’s strikingly similar to February 2020, right before the pandemic, which sat at about 45 days. It also feels a lot like the 2018–2019 market—slower than the frenzy years, but still healthy.

Remember, DOM measures how long a property sits from Active status until it goes under contract (Pending). It doesn’t include the homes that never sell, only the ones that find a buyer.

Why it matters

  • Buyers: You have time to think, inspect, and negotiate. Homes aren’t vanishing in 24 hours anymore.
  • Sellers: A realistic expectation is key. If your home takes 30–60 days to go under contract, that’s not failure – it’s the market.
  • Pricing check: If you’re well beyond the average DOM for your price bracket, it’s a signal to revisit price, condition, or marketing.

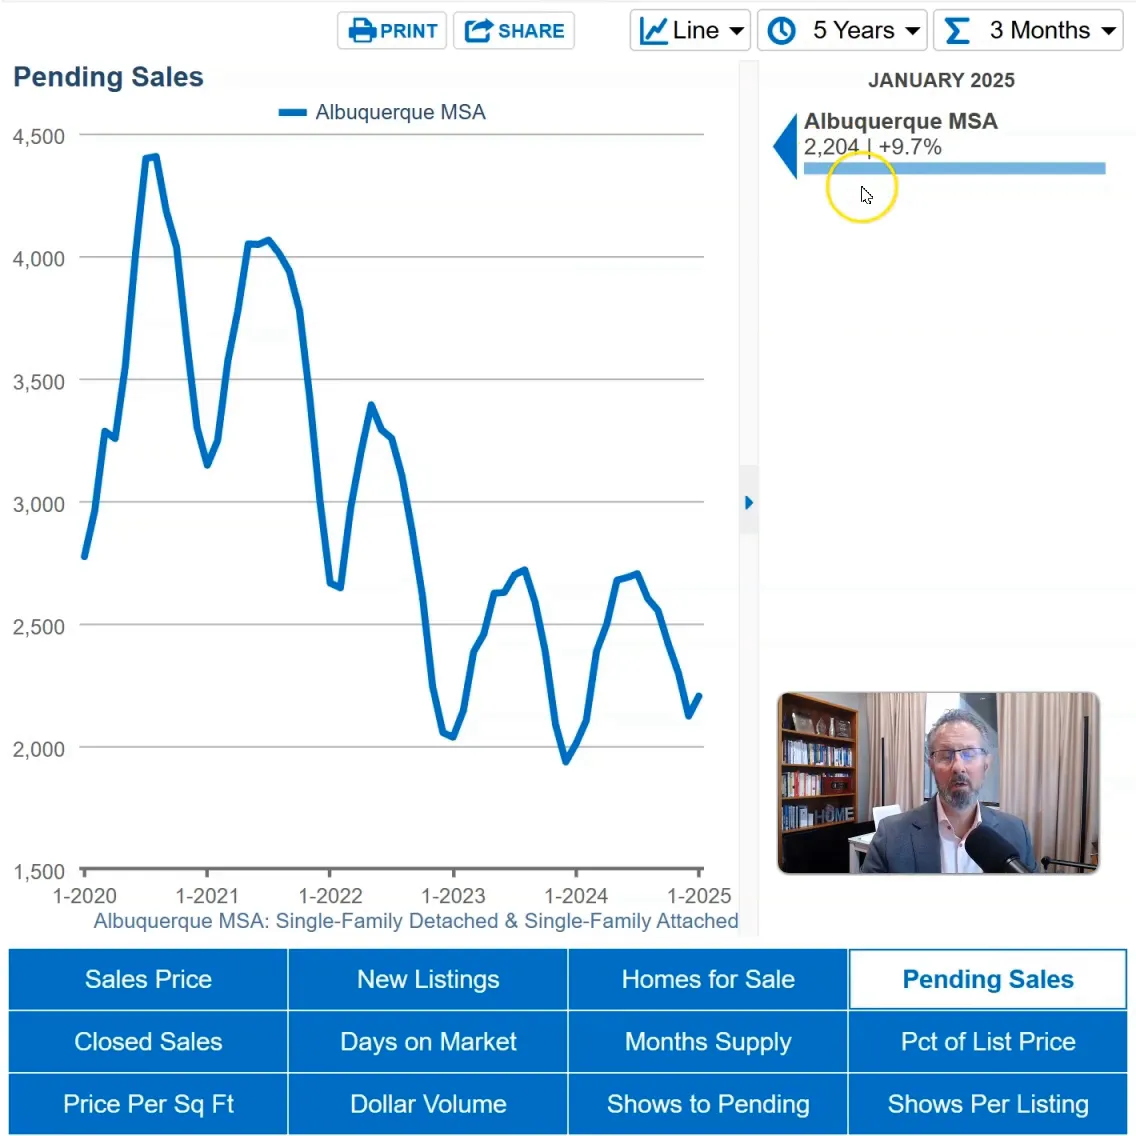
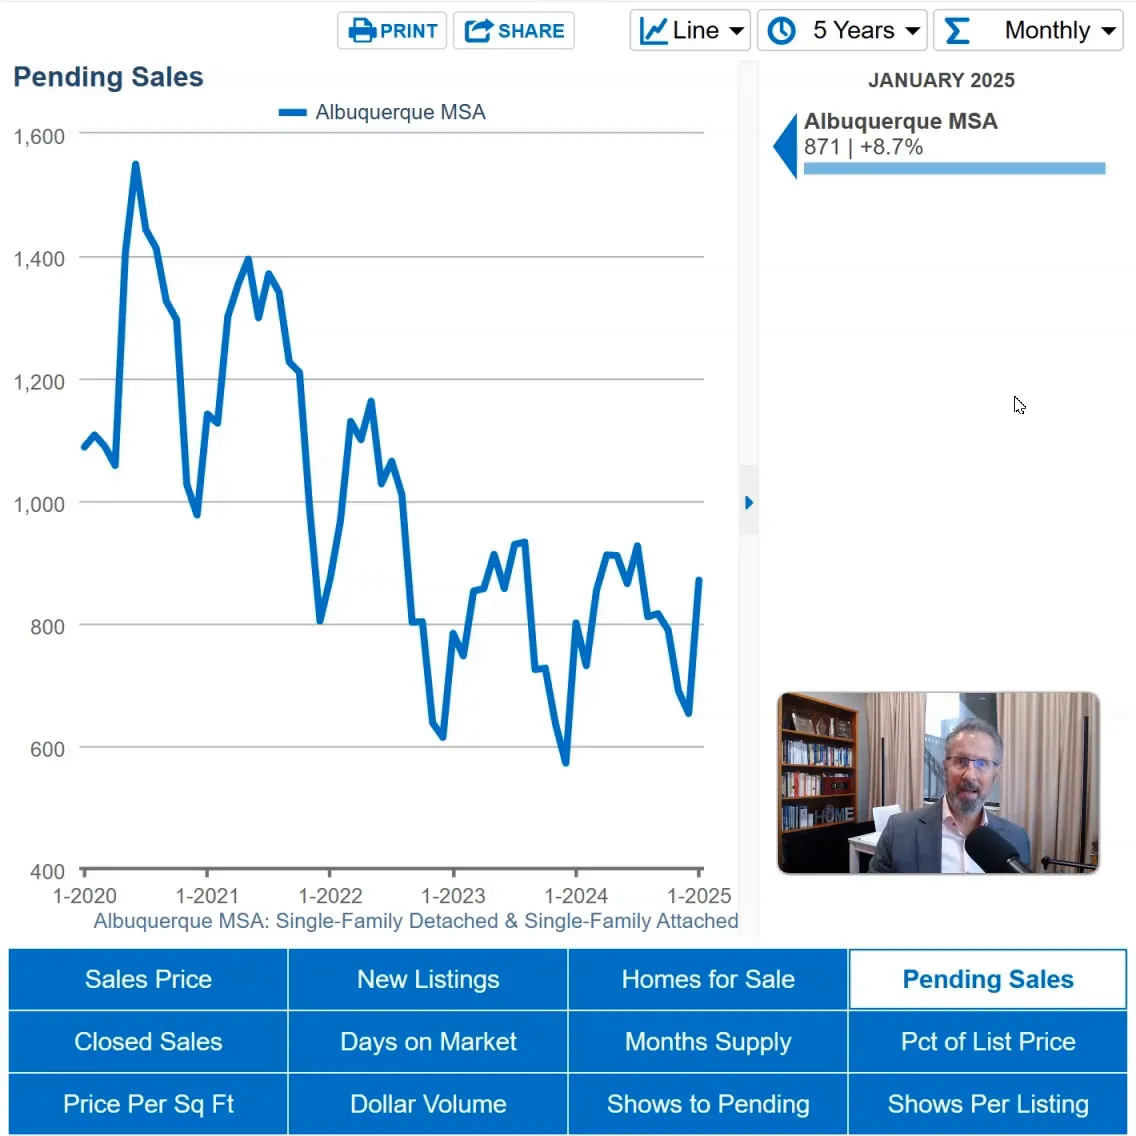
Pending Sales & New Listings: Quiet but Steady

Looking at “homes in pending” each week, we finished November with 969 pending sales, and the 90-day moving average sat around 1,021—just a hair above the same point in 2024 (about 1,002). That tells us there is steady contract activity happening behind the scenes, even if the closed sale count looked weak in November.

New listings are following their usual seasonal pattern. They dropped off sharply through late November and will likely keep easing down into January before picking up again in February and March. For several years in a row, that pattern has repeated almost like clockwork.

Why it matters

  • Buyers: You’ll see fewer fresh options over the holidays, but you can still find opportunities among existing inventory and homes returning to the market.
  • Sellers: Less competition from new listings can help your home stand out if you’re willing to list in December or January.

How Albuquerque Compares & What’s Next for 2026

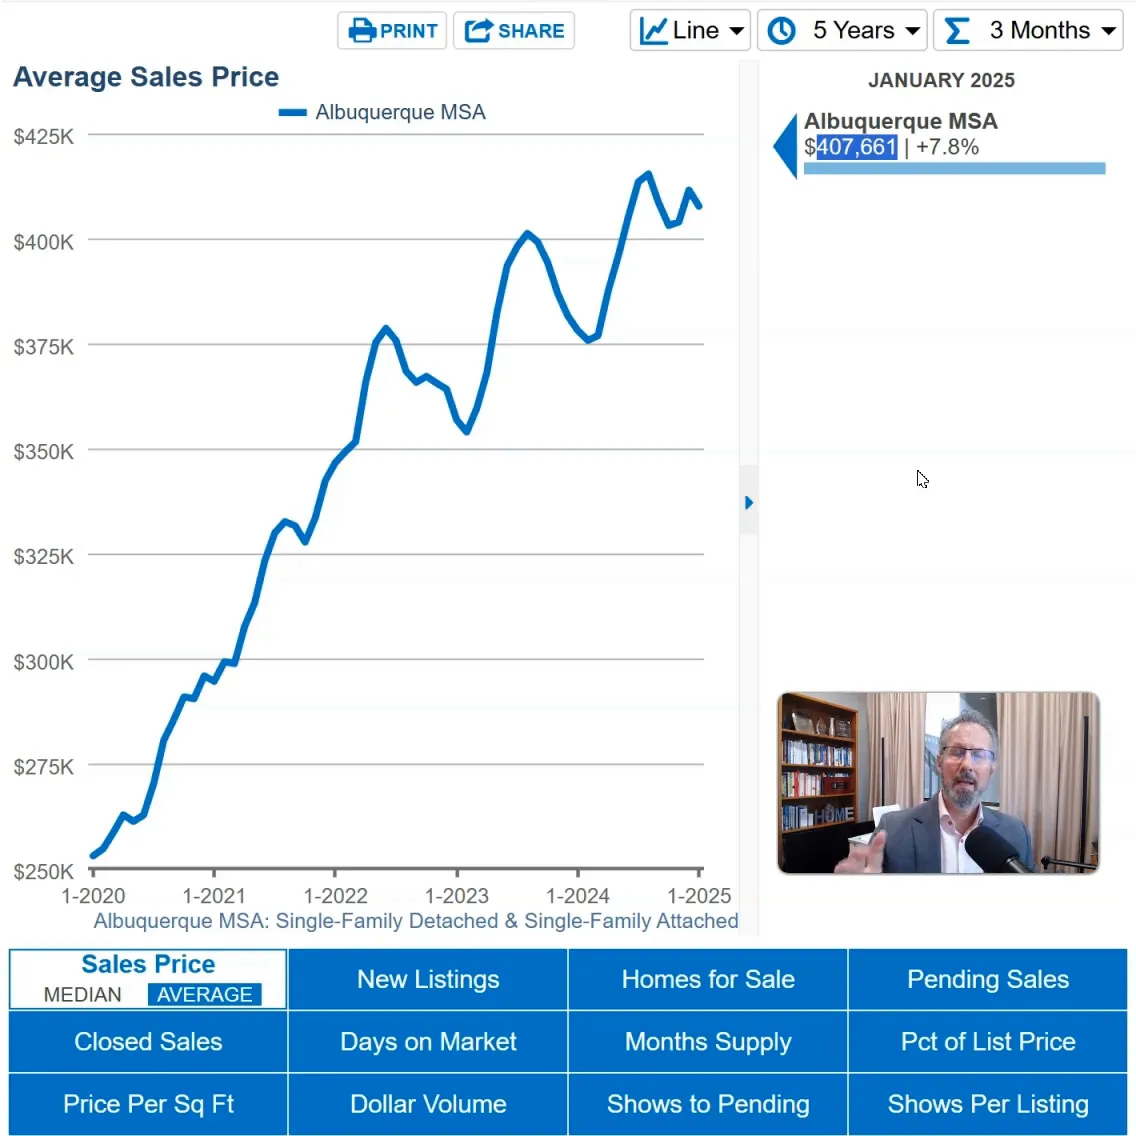
Compared to some big markets—parts of Texas, Denver, and Phoenix—Albuquerque has held up better on prices, with far less downward pressure. Our median of $355,000 and average price around $410,000 still sit below many regional peers, even as we wrestle with our own affordability challenges.

Nationally, the National Association of REALTORS® is projecting about a 14% increase in home sales for next year. If that plays out here, it would mean roughly 1,400 more closed sales on top of the ~10,000 transactions expected in our market for 2025. We’ll see how that forecast lines up with reality once we get into the spring selling season.

Why it matters

  • More move-up and move-down buyers: As rates and affordability stabilize, some of the “locked-in” owners may finally make their move.
  • Pricing stability: A moderate increase in sales without a major inventory surge usually supports flat-to-modest price gains.
  • Planning window: If you’re targeting a move in 2026, now is a good time to tighten up your finances and get a strategy in place.

Buyer & Seller Q&A – November 2025 Edition

Q: Are Albuquerque home prices going up or down right now?

A: For November 2025, the median price was $355,000, down about 1.4% from last November. But looking at the full year, prices are roughly 2–3% higher than 2024, and price-per-square-foot for November is flat year-over-year. In plain English: prices are basically holding steady, not surging or crashing.

Q: Why were November 2025 home sales in Albuquerque so slow?

A: We only saw 638 closings in November, which is low for our market and notably weaker than both October and last November. The holiday calendar, fewer active buyers, and a slower national economy all play a role. The good news is pending sales and showings suggest it’s a soft patch, not a full stop.

Q: How many homes are for sale in Albuquerque right now?

A: The November reading showed about 2,086 active listings. That number moves daily, but it’s a good snapshot: slightly more homes available than last year at this time, but still a bit below 2019 levels, so we’re not in a high-inventory buyer’s market yet.

Q: Why are homes staying longer on the market?

A: Average Days on Market is now around 49 days—up from the frenzy years but similar to 2018–2019 and to pre-pandemic 2020. DOM measures how long it takes a home to go from Active to Pending. With more balanced supply and demand, it’s normal for homes to take 30–60 days to find the right buyer.

Q: Is 2025 a good time to buy a house in Albuquerque?

A: For many buyers, yes. Prices are stable, inventory is modestly higher, and you’re not fighting bidding wars on every well-priced home. Whether it’s “good” for you depends on your budget, job stability, and time horizon. If you plan to own for 5–10 years, a flat or slow-growth market like this can be a solid entry point.

Q: Is now a good time to sell my home in Albuquerque?

A: If you have a compelling reason to move, you can still sell successfully. Prices are near their highs, and inventory is not excessive, which helps well-priced, well-prepared homes stand out – especially during the winter when new listing counts are lower. If you’re flexible on timing, we’ll help you decide whether an early-spring or late-winter launch makes more sense for your specific neighborhood and price point.


About Venturi Realty Group — Data-driven Albuquerque real estate pros with 4,000+ closed transactions and active involvement in GAAR and SWMLS. We host the Albuquerque Real Estate Talk podcast and provide weekly market updates to help you make informed decisions. Call 505-448-8888 or visit WelcomeHomeABQ.com.

Albuquerque Market Updates | Search Homes | Contact Venturi Realty Group

Albuquerque Housing Market Update – November 2025: Steady Pace, Modest Price Growth

Albuquerque Housing Market Update – November 2025: Steady Pace, Modest Price Growth

Albuquerque Housing Market Update – November 2025: Steady Pace, Modest Price Growth

By Venturi Realty Group | November 2025 | Albuquerque, NM Real Estate Market Data

It’s November 2025, and the Albuquerque real estate market continues to move at a steady, measured pace. While the frenzy of 2020–2022 is long gone, sales activity has stabilized, and prices are showing modest, sustainable growth. Whether you’re planning to buy, sell, or simply watch the trends, here’s what the latest housing data reveals about where we stand — and where we’re headed.

Closed Sales: Slightly Down but Steady OverallClosed Sales

In October 2025, 822 homes closed in the Albuquerque area — about 3% fewer than in October 2024 (849 sales). Over the past 12 months, 9,861 homes sold, roughly 3% more than the same period a year ago. That’s a sign of market steadiness. During the record-breaking days of 2021, more than 15,000 homes were sold in a year. We’re now hovering near 10,000 — a clear sign the market has normalized from the pandemic-driven boom.


New Listings: Slight Uptick, but Still Historically LowNew Listings

Over the past year, 12,899 homes were listed — up 4.6% year-over-year. That’s progress, but still far below the 18,000+ annual listings common from 2015–2019. The reason is the “lock-in effect”: homeowners with low 3% mortgage rates are staying put. Expect this slow-moving trend to take years to rebalance as rates and lifestyles evolve.

Inventory: Technically a Seller’s Market, Functionally Balanced

Albuquerque currently has 2.8 months of housing supply — below the traditional 5–6 months that mark a balanced market. Technically, that’s a seller’s market, but in practice, the playing field feels even. Sales are taking longer, buyers have more leverage, and overall conditions favor neither side strongly.

Days on Market: Returning to Pre-Pandemic Norms

  • Median days on market: 22 (up from 18 a year ago)
  • Average days on market: 41 (up from 37 a year ago)

Homes are taking slightly longer to sell, but these numbers mirror 2018–2019 — a healthier, sustainable pace. During the frenzy of 2021, the median was just three days, a stark contrast to today’s steadier market.

Prices: Moderate and Sustainable GrowthAlbuquerque MSA Median Sale Price

  • Median sales price: $364,450 (+1.2% YoY)
  • Average sales price: $423,274 (+3.6%)
  • Price per sq. ft.: $213 (+1.4%)

These modest increases reflect a healthy, sustainable market. Most neighborhoods are holding steady with light upward price pressure — stability replacing volatility.

Pending Sales: A Preview of the Months AheadNovember 2025 Pending Home Sales Albuquerque

On average, 1,046 homes are under contract at any given time — slightly higher than last year’s 1,023. The median list price of pending homes is $379,990, up about 4% from 2024. This points to continued, moderate appreciation through early 2026.

Market Outlook: 2026 and Beyond

  • Sales pace: Stable but slower than the boom years
  • Prices: Modest appreciation expected through 2026
  • Inventory: Tight but gradually improving

The “lock-in effect” will continue to shape supply, but steady demand keeps prices supported. If mortgage rates ease in 2026, expect a wave of “pent-up movers” to re-enter the market.

FAQs: Albuquerque Housing Market, November 2025

Is it still a seller’s market in Albuquerque?

Technically, yes, with 2.8 months of supply, but functionally, it’s balanced. Buyers have more time, and homes take longer to sell.

Are home prices still rising?

Yes — prices are up around 1–3% year-over-year, reflecting a steady, sustainable pace.

How long are homes taking to sell?

The median is about 22 days, up from 18 last year, similar to pre-pandemic norms.

Are new listings increasing?

Slightly — up 4.6% year-over-year — but still far below pre-pandemic levels due to the lock-in effect.

What can buyers expect in 2026?

Stable conditions, modest price gains, and potentially more options if rates ease.

Conclusion

The Albuquerque real estate market in late 2025 is steady, sustainable, and balanced. Prices are inching up, homes are selling at a reasonable pace, and volatility has faded.

For deeper charts and data, visit WelcomeHomeABQ.com and explore the Market Data section — or call Venturi Realty Group at 505-448-8888 for personalized guidance.

Albuquerque Housing Market Update – Long-Term Trends & Aug 2025 Data

Albuquerque Housing Market Update – Long-Term Trends & Aug 2025 Data

Albuquerque Housing Market Long-Term Snapshot — September 2025

This week, I stepped back from the month-to-month noise to show where Albuquerque stands over the long run. We’ll hit the key numbers—average and median prices, price-per-sq-ft, inventory, new listings, closed and pending sales, days on market, months of supply, and typical seller discounts—and turn them into practical guidance for buyers, sellers, and fellow agents. I’ll also point you to the weekly charts and trackers I use so you can follow along anytime.

Average sale prices in August 2025 for detached and attached homes in Albuquerque

Why look long-term?

Monthly snapshots swing with seasonality. Long-term charts separate normal cycles from real shifts. When you zoom out, past 2022’s ultra-tight inventory and the oversupply of 2007–2008, you see where today’s market fits in relation to “normal.” Albuquerque has eased off the 2022 extremes, but is nowhere near the 2007–2008 glut. Prices are up modestly; the sales pace is slower than in several pre-pandemic years. 

Prices: Average, Median, and $/SqFt

August 2025:

  • Average sale price (detached): $443,816
  • Average sale price (attached): $285,144
  • Median sale price (detached): $379,000 — a new high
  • Median sale price (attached): $279,000

Median price per square foot for attached vs detached homes

Two quick notes:

  1. Averages can get skewed by a few high or low outliers. I lean on the median for a cleaner read.
  2. Detached median at a record matters, even if averages wobble month to month.

$ / SqFt helps normalize for size:

  • Attached median $/SqFt: $207
  • Detached median $/SqFt: $216 (basically ties the March 2025 peak)

Bottom line: single-family values sit near record territory; attached homes remain a relative value. 

What it means

Sellers: Pricing can be confident but must be precise. Clean presentation still wins.
Buyers: Expect higher prices for detached homes vs condos and townhomes. However, be sure to compare attached homes, including association fees, as they can often be quite high.

Inventory: Choice vs. Leverage

Historic inventory path: 2007–2008, 2015–2019, 2022, and 2025

  • Average active in Aug: 2,108 detached | 218 attached

More choice than 2022. Still below 2018–2019. Far from 2007–2008. Translation: balanced-leaning-seller, not overheated.

Seasonality + the “Lock-In” Effect

New listings trend with clear spring/summer peaks

  • New listings (Aug): 1,062 detached | 117 attached

Spring and early summer are the listing peaks. Many owners are “locked in” with low rates and comfortable payments, so they stay put. That keeps supply muted and shifts strategy toward presentation and pricing.

Closed & Pending Sales

Monthly closed sales, detached vs attached

  • Closed (Aug): 770 Detached | 87 Dttached

Volume sits below 2015–2019 norms. Demand is steady, not “blowing the doors off.” Expect less frenzy, more normal negotiation. 

Days on Market

Average and median DOM for detached homes, August 2025

  • Avg DOM (detached): 38 days
  • Median DOM (detached): 19 days

Median under three weeks means well-priced, well-presented homes still move. The higher average is pulled up by lingerers. Plan accordingly. 

Months of Supply

Months of supply near 2.8 detached and 2.7 attached

  • Detached: 2.8 months
  • Attached: 2.7 months

Technically a seller’s market, but without 2021–2022 heat. Strategy and accuracy beat hype.

Discount off List Price

Average percent of list price received

  • Detached: ~98.5% of list (at contract)
  • Attached: ~97.2% of the list

Mostly just under ask—very different from 2022’s 100%+ era, and similar to 2018–2019.

How I use the Trackers

Weekly tracker summary with current inventory read

I maintain a monthly tracker for the long view and a weekly tracker for the pulse. Example: for the week ending Sept 5, 2025 the weekly snapshot showed ~2,065 detached homes on market. Use these to watch how rates and seasonality move the numbers. 

QuickTakeaways from the August 2025 Data

  • Detached median price at a record; detached $/SqFt near peak.
  • Inventory up from 2022 but still under some 2018–2019 levels.
  • Sales volume below 2015–2019. Negotiation is back to normal.
  • Median DOM is ~19 days; the average is 38, with pricing and presentation determining the speed.
  • ~2.7–2.8 months of supply = seller-leaning, not overheated.
  • Typical sale price is ~97%–98.5% of the list price, depending on the property type.

In short: a steady, healthy market that rewards good pricing, sharp marketing, and sensible negotiation.

Want this applied to your property?

Every neighborhood is its own micro-market. If you’d like a custom read – CMA, pricing plan, or buy-side strategy—call or text the Venturi Group at (505) 448-8888. We’ll map these trends to your goals. 

Thanks for reading. I’ll keep the trackers current so you can follow along anytime.

Tego

Albuquerque Home Prices & Values – August 2025 Update

Albuquerque Home Prices & Values – August 2025 Update

Albuquerque Home Prices & Values – August 2025 Update

The Zillow Home Value Index (ZHVI) tracks the estimated value of every home, sold or not, giving a reliable view of where prices are heading.
Individual Zestimates can vary, but in aggregate, the trend data for the Albuquerque area is a strong market gauge.


Quick Snapshot – July 2025 Albuquerque Home Values

Metric Value Change vs. June 2025 Change vs. July 2024
Typical Albuquerque Home Value (ZHVI) $346,000 +0.12% +1.84%

Key takeaway: Values are up modestly year-over-year, with lighter-than-usual month-to-month gains for this time of year.


From 1999 through July 2025, Albuquerque shows steady long-run appreciation with normal cycles.
Historically, June→July averages +0.71%; in 2025, it was +0.12%, indicating slower seasonal appreciation this year.

Monthly percent change in Albuquerque home values, 1999–2025, showing slower-than-average June-to-July 2025 gain.


Monthly percent change in Albuquerque home values, 1999–2025, showing slower-than-average June-to-July 2025 gain.


How Albuquerque Compares Nationally

  • Albuquerque: +1.8% YoY
  • Stronger metros: Hartford (~+4.5%), Detroit (~+4%), Rochester (~+4%)
  • Weaker metros: Many Florida metros (~−10%), Austin (~−6%)
  • One-year change in metro-level home prices between July 2024 and July 2025

Real estate is local. Albuquerque is outperforming several Southwest peers (e.g., Phoenix down, El Paso near flat).


12-Month Forecast

Zillow’s outlook places Albuquerque in the Top 10 for expected appreciation:

+2% over the next year vs. +0.4% nationally. Interactive chart HERE

One Year Home Value Forecast - Largest 100 US Markets - July 2025 to July 2026
The local projection ticked up from ~+1.5% last month. El Paso is similarly projected around +2%.


Market Pace & Sales Volume

  • Projected 2025 sales: ~10,000 homes (vs. ~15,000 in 2021)
  • Inventory: Still below 2019 levels, which supports prices despite slower activityAnnual Closed Home Sales Albuquerque Area


FAQs: Albuquerque Home Values

What is the typical home value in Albuquerque right now?

The ZHVI shows $346,000 for July 2025.

Are Albuquerque home prices rising or falling?

Rising modestly: +1.84% year-over-year, but slower month-to-month than the long-run average.

How does Albuquerque compare to the U.S. overall?

National forecast is ~+0.4%; Albuquerque is projected at +2% from July 2025 to July 2026, among the stronger markets.

Why use ZHVI instead of recent sales only?

ZHVI tracks every home (sold or not), giving a broader read on local value trends, not just sale price trends.

Is it a buyer’s or seller’s market?

Closer to balanced than we have seen since 2019. Limited inventory still gives sellers leverage; buyers have more choice than during the boom. However, it will depend on the home price point, home condition, and location.

Local Insight

Albuquerque has been resilient. The market is steady, not surging. Sellers should price strategically. Buyers should act on well-priced homes while selection is better than in prior boom years.


Albuquerque Real Estate: February 2025 Market Insights

Albuquerque Real Estate: February 2025 Market Insights

Albuquerque Real Estate: February 2025 Market Insights

Welcome to the latest update on Albuquerque real estate! As we kick off February 2025, let’s dive into the current housing market trends, explore crucial statistics, and forecast what to expect in the coming months.

Introduction to February 2025 Market Overview

As we step into February 2025, the Albuquerque real estate market continues to reveal intriguing trends. The data indicates a shift in dynamics that could shape the market for months to come. By analyzing recent statistics, we gain insight into sales, inventory, and pricing, painting a clearer picture of what buyers and sellers can expect moving forward.

Methodology: Rolling Three-Month Analysis

This month, we’re taking a different approach by utilizing a rolling three-month analysis. Instead of comparing January to January of the previous year, we’re examining the combined data from November, December, and January. This broader time frame allows us to capture fluctuations and trends that might otherwise go unnoticed, providing a more comprehensive understanding of the Albuquerque housing landscape.

Closed Sales: A Positive Trend

In the Albuquerque area, the closed sales have shown promising growth. Over the last three months, we recorded 2,190 closed sales, marking an 11% increase compared to the same period last year. This upswing suggests a resurgence in buyer activity, which is particularly noteworthy given that 2023 was one of the lowest years for unit sales in recent history and 2024 was not far behind.

Closed sales chart for Albuquerque real estate

Understanding Home Supply Levels

Home supply levels serve as one of the simplest indicators of market health. Currently, we see a 25% increase in the number of homes for sale compared to last year, yet we remain below pre-pandemic levels. This persistent constraint in supply indicates that while more homes are entering the market, we are still not at a point where supply puts us in a technical buyers’ market as demand stays steady.

Home supply levels over the years

Pending Sales: An Upward Movement

Pending sales have also seen a slight upward movement, with an increase of approximately 10%. A total of 2,204 homes were put under contract in the last three months, which, although an improvement from last year, still reflects a subdued activity level compared to more “typical” years. This increase in pending sales is a positive sign, suggesting that buyers are actively engaging with the market.

Pending sales trend in Albuquerque

Pricing Stats: Analyzing Average and Median Prices

When we dive into pricing statistics, we find that the average price of homes sold over the last three months stands at $407,661. This represents a 7.8% increase from the same period last year. However, it’s crucial to remember that this average does not necessarily reflect a uniform appreciation across all homes in the market.

Average home prices in Albuquerque

The median price, which indicates the middle ground of home sales, is currently $355,000. This figure is down slightly for the all-time high of June 2024 of $415,000, showcasing the ongoing appreciation in home values. Notably, the median price per square foot has risen to $211, reflecting a 4.5% increase from the previous year, aligning with the overall trends of moderate price appreciation in the Albuquerque real estate market.

Median home price trends

Analyzing these statistics reveals steady market growth compared to 2023 and 2024. Buyers now have more options, benefiting home buyers, while sellers face more competition. Understanding these dynamics is crucial for navigating the Albuquerque real estate market.

Market dynamics overview

For those interested in exploring further, we invite you to visit our website for more detailed Albuquerque housing market statistics and insights. The Albuquerque real estate market is evolving, and staying informed is key to making the best decisions whether you’re buying or selling.

Home Price Per Square Foot: A Deeper Look

When analyzing the Albuquerque real estate market, the price per square foot offers valuable insights into the overall health and trends of home values. Currently, the median price per square foot stands at $211, reflecting a 4.5% increase from the previous year. This figure is significant as it indicates a consistent appreciation in value, aligning with the broader market trends.

Price per square foot trend in Albuquerque

Days on Market: Returning to Normalcy

The average days on market for homes in Albuquerque are returning to a more normalized pace. Currently, homes are averaging around 42 days to go under contact, and the median days on market is 24, a stark contrast to the frenzied environment of 2021 when some properties sold in just hours. This shift signifies stabilization in the market, allowing buyers more time to make informed decisions without the pressure of immediate competition.

While this may seem slower, it actually reflects a healthier market dynamic. Sellers are adjusting their expectations, and buyers can negotiate better terms. As we look ahead, it’s crucial for all parties involved to understand that a more stable market can lead to sustainable growth over time.

Average days on market trend

Real-Time Pending Status: Current Contracts and Future Sales

In the current market, pending status homes are a vital indicator of future sales trends. As of now, there are 939 homes in pending status, a notable increase from 831 homes this time last year. This uptick is a positive sign, indicating that buyer interest remains strong despite the fluctuations in supply and demand.

These pending homes are critical for predicting future sales prices. For instance, the median price of homes currently under contract is $212 per square foot, reinforcing the ongoing trend of moderate price appreciation in the Albuquerque market. This data suggests that buyers are willing to pay for homes that match their needs, which bodes well for future market stability.

Pending status homes in Albuquerque

Conclusion: What Lies Ahead for Albuquerque Real Estate

Looking ahead, the Albuquerque real estate market appears to be on a stable path. With a healthy increase in both supply and buyer interest, we expect continued moderate price appreciation. The overall economic indicators suggest that the market will maintain its momentum, with potential for growth as we move further into 2025.

Buyers should take advantage of the increased inventory, while sellers can feel confident knowing that demand remains steady. As always, staying informed and adaptable will be key to navigating this evolving landscape.

Future outlook for Albuquerque real estate

FAQ: Common Questions about the Albuquerque Housing Market

What is the current average home price in Albuquerque?

The average home price in Albuquerque is currently around $407,661, reflecting a 7.8% increase from the same period last year.

How long do homes typically stay on the market?

Homes in Albuquerque are currently averaging around 42 days on the market, indicating a return to a more normalized pace compared to previous years.

Is it a good time to buy in Albuquerque?

With increased inventory and moderate price appreciation, now can be a favorable time for buyers looking to take advantage of more options in the market.

What factors influence home prices in Albuquerque?

Key factors include supply and demand dynamics, interest rates, economic conditions, and the overall desirability of the Albuquerque area.

Where can I find more information about Albuquerque real estate?

For more detailed statistics and insights, visit our real-time Albuquerque Housing market tracker page.


Albuquerque Housing Market: September 2024 Insights and Trends

Albuquerque Housing Market: September 2024 Insights and Trends

As the Albuquerque Housing Market continues to evolve, September 2024 brought changes in sales, mortgage rates, and pricing trends. This blog summarizes the video market update and provides an overview of what buyers and sellers can expect in the current market.

Overview of the Real Estate Landscape

The Albuquerque Housing Market has been undergoing notable shifts in recent months. As of September 2024, closed sales for single-family homes in the Albuquerque metropolitan area totaled 766, reflecting an 8.5% decrease compared to September of 2023. The decline indicates a slowdown in transactions, a sentiment experienced by local realtors and market observers.

Despite the drop in closed sales, there is a contrasting trend in pending sales. The number of homes going under contract surged to 910, marking a remarkable 25.5% increase from the same month last year. This spike suggests that while closed sales have decreased, interest in purchasing homes increased for the month.

Pending sales chart showing significant increase

Pending Sales Surge

The surge in pending sales is noteworthy for the Albuquerque Housing Market. The jump to 910 pending sales in September, from 823 in August, is unusual for September, traditionally a month where pending sales begin to decline. This increase may signal a shift in buyer sentiment, potentially spurred by favorable mortgage rates that have recently been trending downward.

The contrast between closed sales and pending sales raises questions about the dynamics at play in the market. If more buyers are entering contracts, it could indicate a future rebound in closed sales as these transactions complete in the coming months.

Graph showing pending sales trends

Seasonal Patterns in Sales

Understanding the seasonal patterns in the Albuquerque Housing Market is crucial. Historically, the market experiences peaks in sales during the spring and summer months, with a gradual decline as the year progresses. However, the data from September 2024 suggests a deviation from this trend, with pending sales increasing rather than decreasing.

This anomaly may prompt a reevaluation of the typical seasonal expectations. Buyers may be adjusting their strategies, taking advantage of current mortgage rates and the availability of homes on the market.

Monthly Pending Sales – September (Highlighted in Red)

Impact of Mortgage Rates

Mortgage rates have played a pivotal role in shaping the current landscape of the Albuquerque Housing Market. As of early October 2024, mortgage rates have risen to around 6.5%. This increase follows a period of decline from higher rates experienced earlier in the year.

Lower rates often appear to have stimulated demand, while rising rates can dampen enthusiasm. The recent drop to the low six percent range sparked interest, however, the rise in rates may pose challenges for potential buyers moving forward. Time will tell.

Chart showing recent mortgage rate trends

Current Pricing Trends

When examining home prices in the Albuquerque Housing Market, the median home price in September 2024 was recorded at $341,500. This figure represents a slight decrease of 1.6% compared to the previous year. However, when looking at the median price per square foot, there was a 3% increase, suggesting that overall home values may still be appreciating, albeit at a slower pace than in previous years.

This mixed data on pricing indicates that while some segments may be experiencing downward pressure, others are holding steady or even appreciating. The current market dynamics reflect a complex interplay of supply, demand, and economic factors that buyers and sellers must navigate.

Graph illustrating median home prices

Inventory Levels and Market Dynamics

The month’s supply of homes for sale is another critical metric when assessing the Albuquerque Housing Market. Currently, it is 2.4 months’ supply across all price ranges, which indicates a seller’s market, as anything below five months is typically categorized as such. However, inventory levels vary significantly across different price ranges.

For homes priced between $250,000 and $400,000, the supply is tighter at just 1.8 months, while homes above $600,000 see a more balanced supply of 4.4 months. This underscores the importance of understanding specific market segments when evaluating real estate opportunities.

Inventory levels chart by price range


Inventory levels by price range

Market Dynamics by Price Range

  • Under $250,000: Extremely limited inventory with only 1.4 months of supply, indicating strong demand.
  • $250,000 to $400,000: Tighter supply at 1.8 months, making it a competitive segment for buyers.
  • $400,000 to $600,000: Moderate supply, allowing for more options but still favoring sellers.
  • Over $600,000: Balanced market with 4.4 months of supply, indicating longer selling times and increased competition among sellers.

This segmentation underscores the importance of understanding market dynamics at various price points. Buyers in lower price ranges face a more competitive environment, while those looking at luxury properties may find more opportunities.

Resources for Further Insights

For those seeking deeper insights into the Albuquerque Housing Market, numerous resources are available. The Venturi Group provides comprehensive market statistics on their website, including:

Accessing these resources can offer buyers and sellers a competitive edge, ensuring they are equipped with the latest data to make informed decisions.

Website resources for market insights

Conclusion and Contact Information

As we assess the Albuquerque Housing Market in September 2024, several key themes emerge. While closed sales have decreased, the surge in pending sales indicates a resilient demand. Pricing dynamics show mixed trends, with overall prices slightly down but the price per square foot appreciating.

With a seller’s market prevailing, particularly in lower price ranges, it’s crucial for potential buyers and sellers to stay informed. Understanding these market nuances can greatly influence decision-making in this competitive environment.

If you have any questions or need help navigating the Albuquerque housing market, feel free to reach out to us at (505) 448-8888 for personalized insights and guidance.