Albuquerque Housing Market Update – Long-Term Trends & Aug 2025 Data
Albuquerque Housing Market Long-Term Snapshot — September 2025
This week, I stepped back from the month-to-month noise to show where Albuquerque stands over the long run. We’ll hit the key numbers—average and median prices, price-per-sq-ft, inventory, new listings, closed and pending sales, days on market, months of supply, and typical seller discounts—and turn them into practical guidance for buyers, sellers, and fellow agents. I’ll also point you to the weekly charts and trackers I use so you can follow along anytime.
Why look long-term?
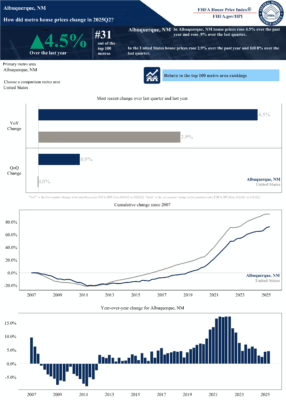
Monthly snapshots swing with seasonality. Long-term charts separate normal cycles from real shifts. When you zoom out, past 2022’s ultra-tight inventory and the oversupply of 2007–2008, you see where today’s market fits in relation to “normal.” Albuquerque has eased off the 2022 extremes, but is nowhere near the 2007–2008 glut. Prices are up modestly; the sales pace is slower than in several pre-pandemic years.
Prices: Average, Median, and $/SqFt
August 2025:
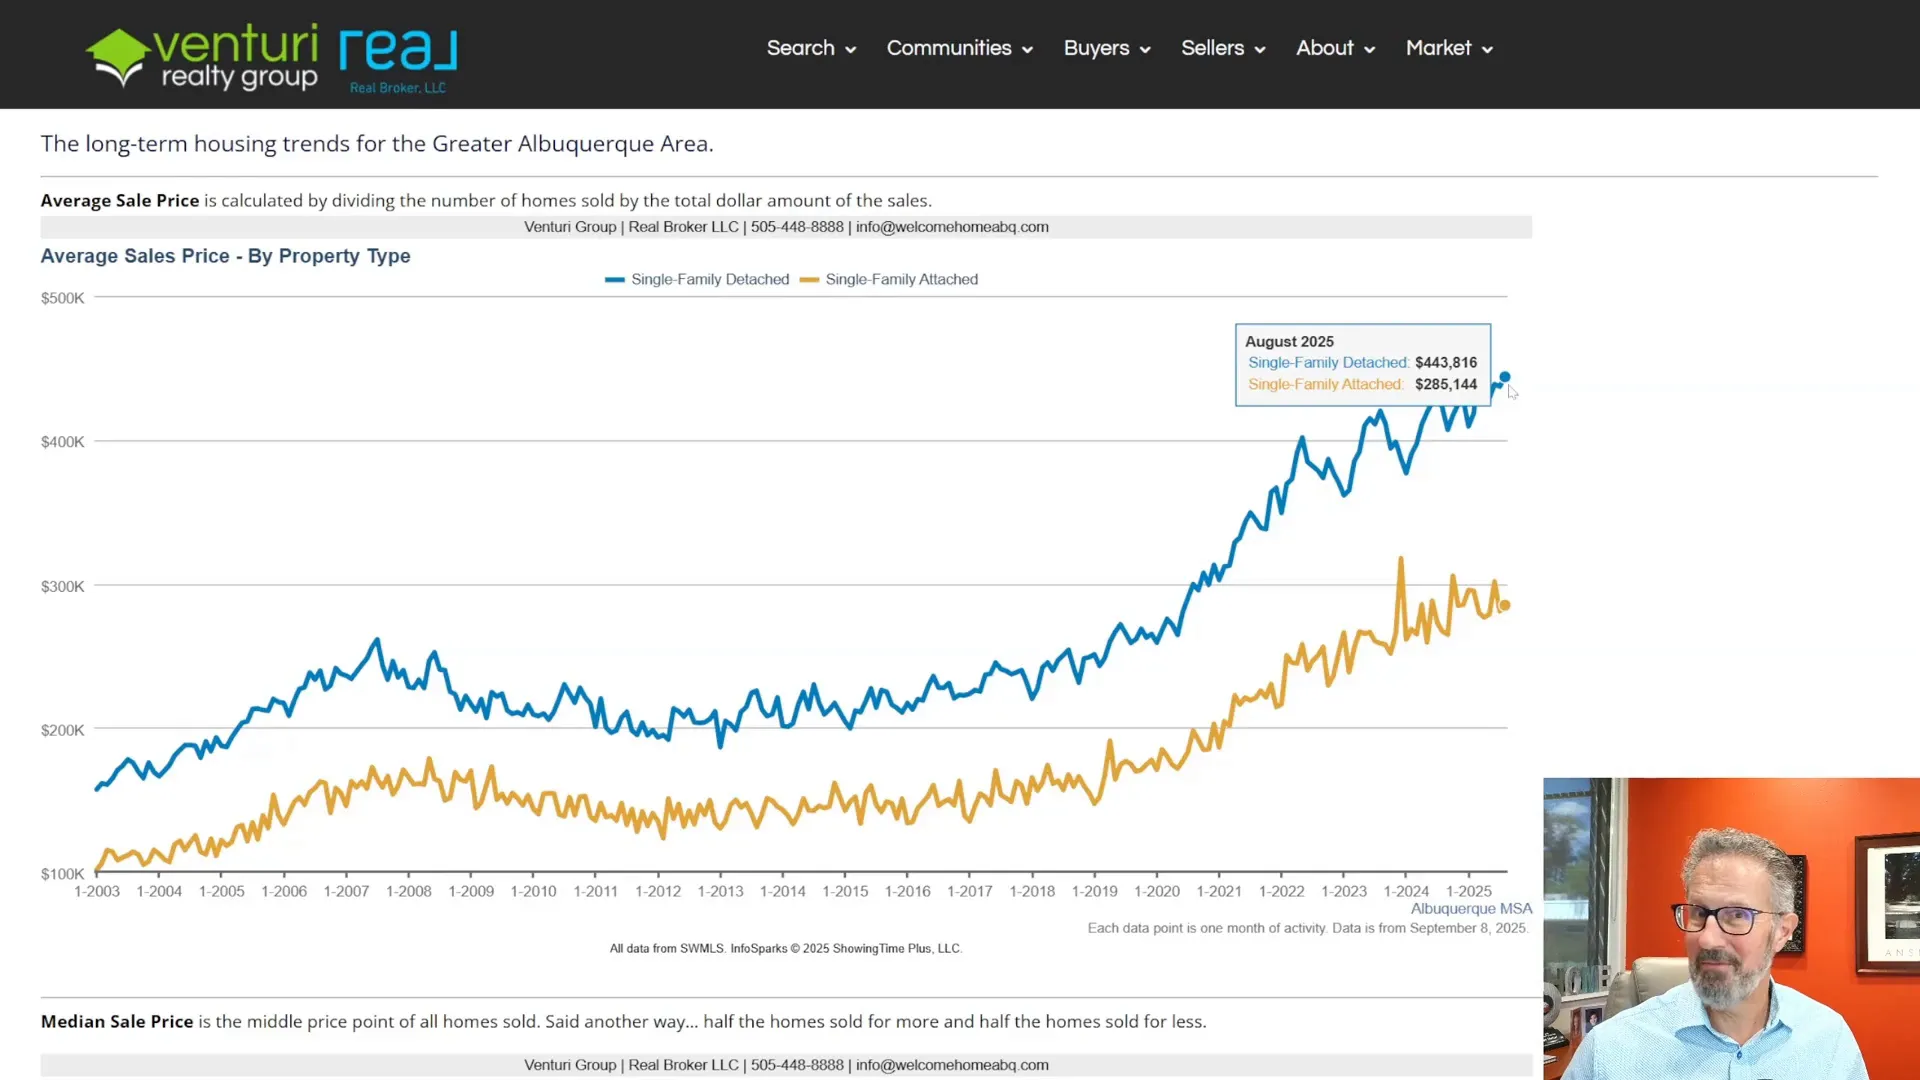
- Average sale price (detached): $443,816
- Average sale price (attached): $285,144
- Median sale price (detached): $379,000 — a new high
- Median sale price (attached): $279,000
Two quick notes:
- Averages can get skewed by a few high or low outliers. I lean on the median for a cleaner read.
- Detached median at a record matters, even if averages wobble month to month.
$ / SqFt helps normalize for size:
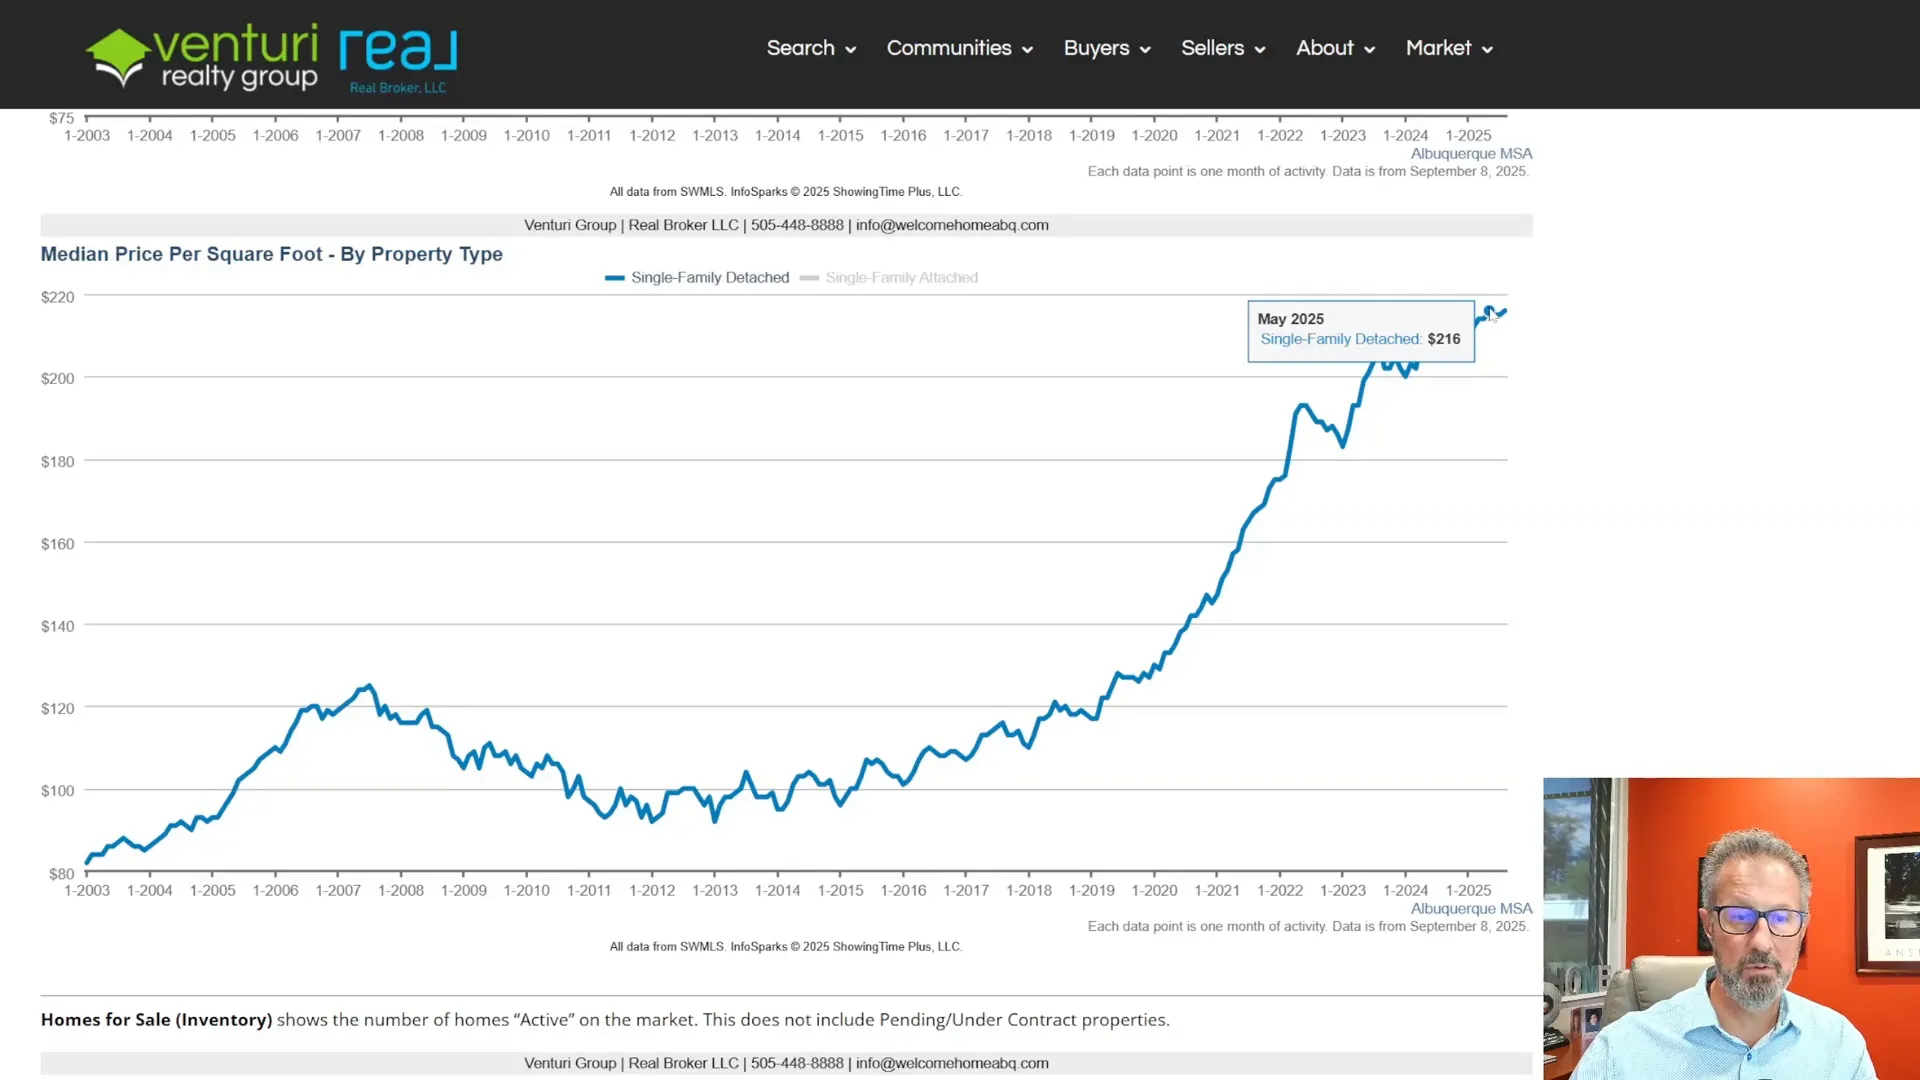
- Attached median $/SqFt: $207
- Detached median $/SqFt: $216 (basically ties the March 2025 peak)
Bottom line: single-family values sit near record territory; attached homes remain a relative value.
What it means
Sellers: Pricing can be confident but must be precise. Clean presentation still wins.
Buyers: Expect higher prices for detached homes vs condos and townhomes. However, be sure to compare attached homes, including association fees, as they can often be quite high.
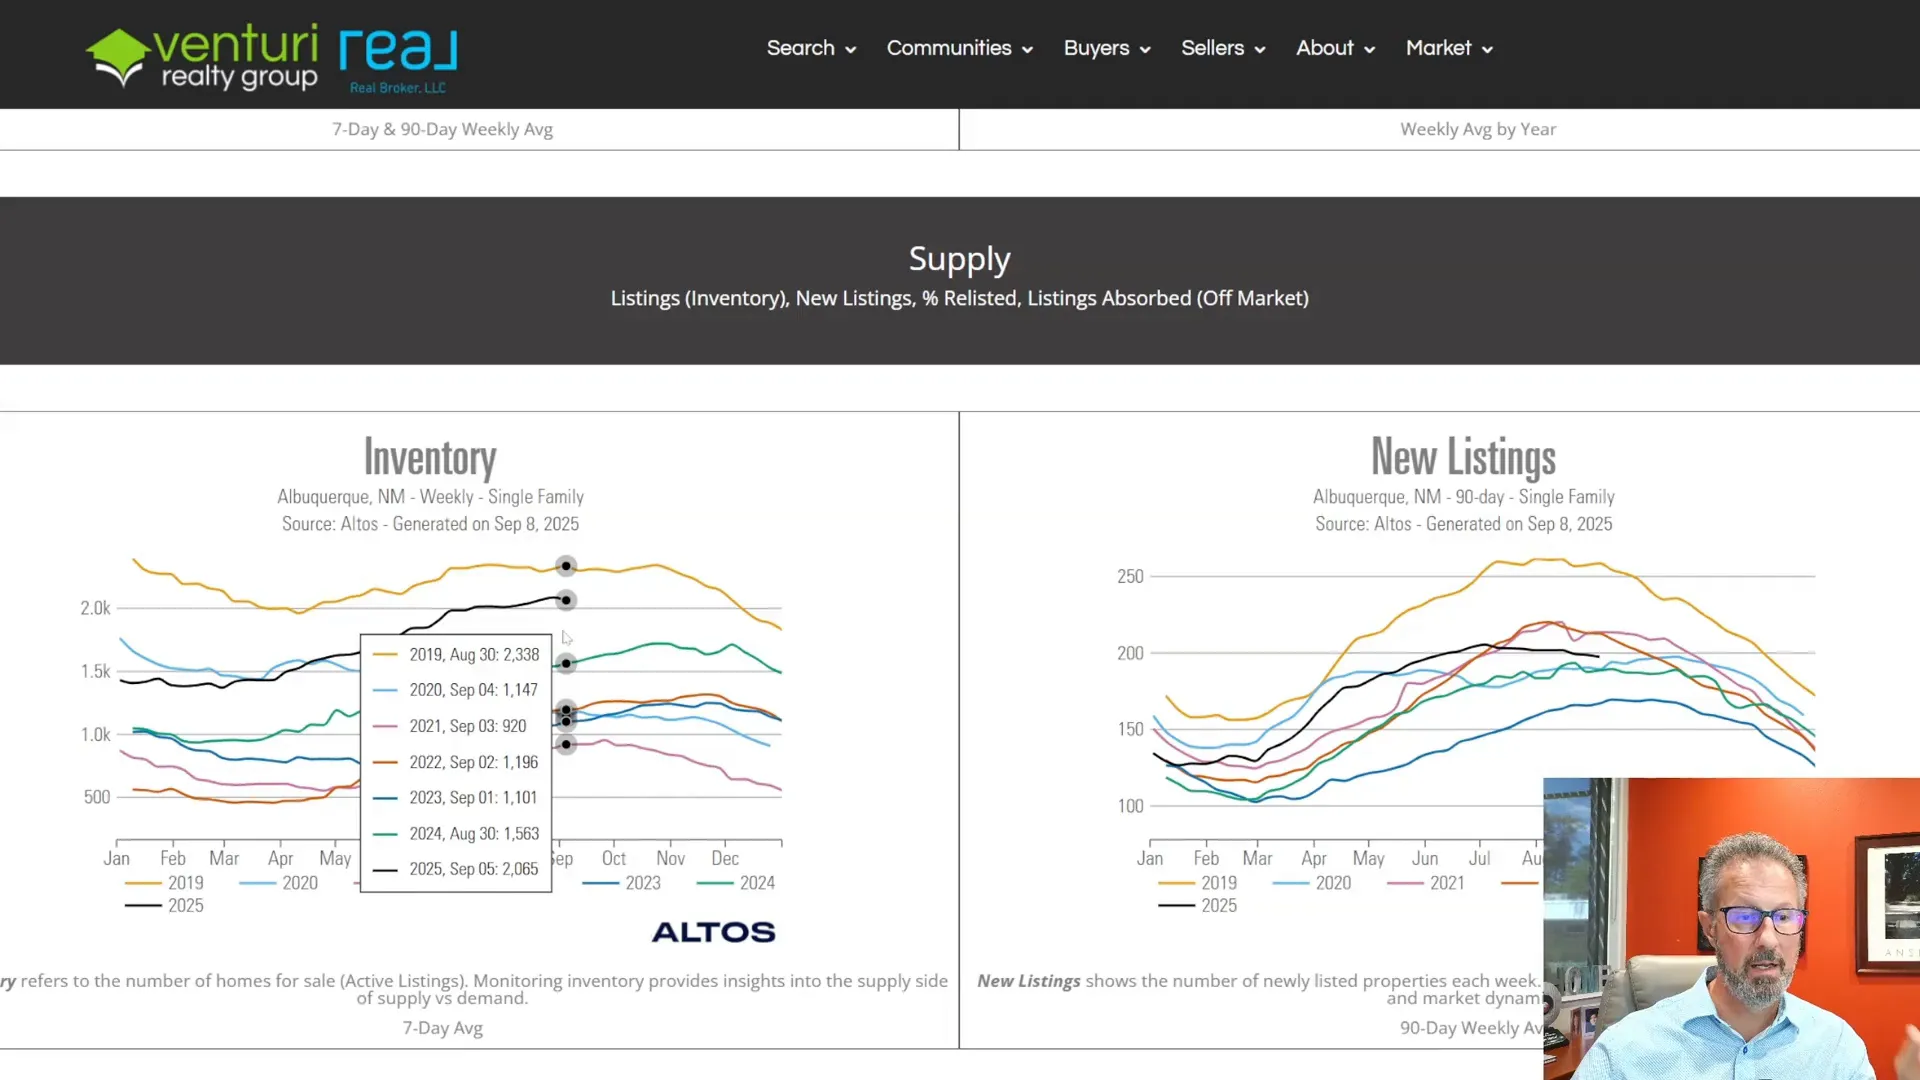
Inventory: Choice vs. Leverage
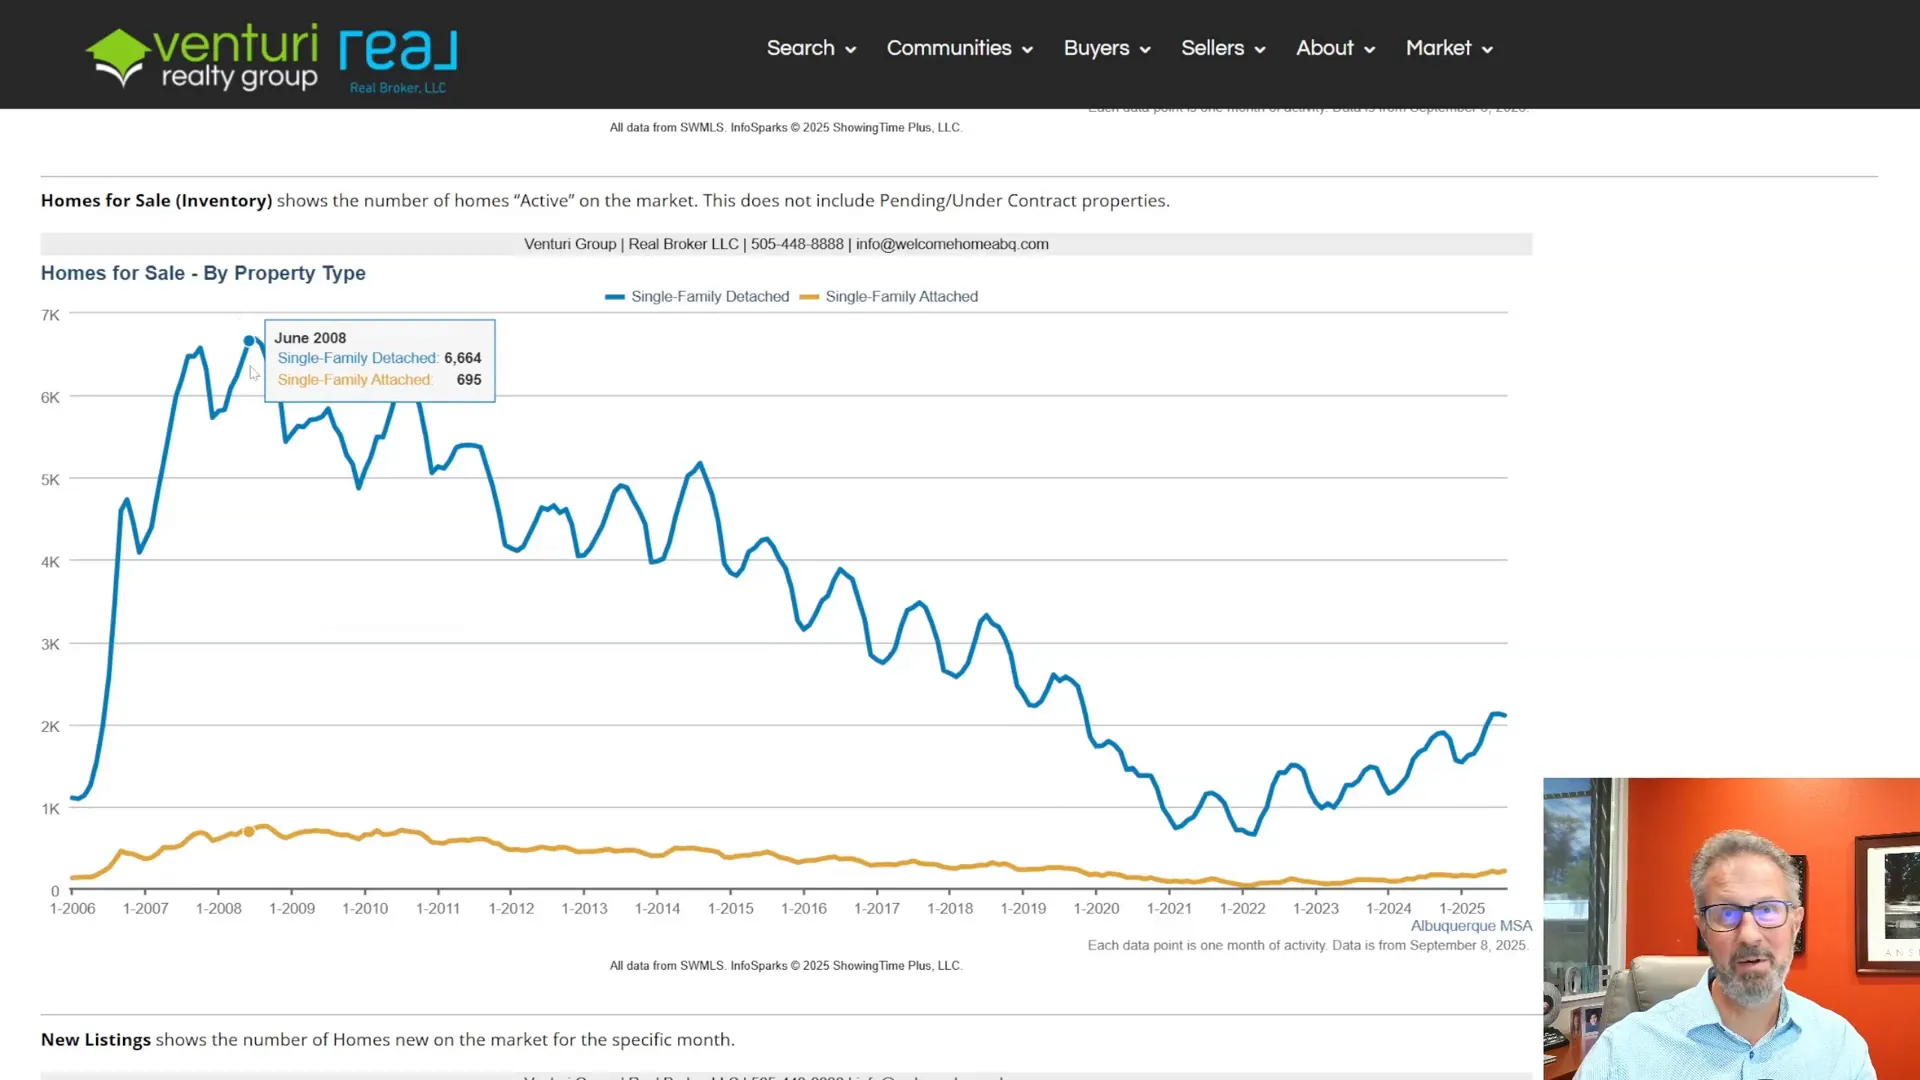
- Average active in Aug: 2,108 detached | 218 attached
More choice than 2022. Still below 2018–2019. Far from 2007–2008. Translation: balanced-leaning-seller, not overheated.
Seasonality + the “Lock-In” Effect
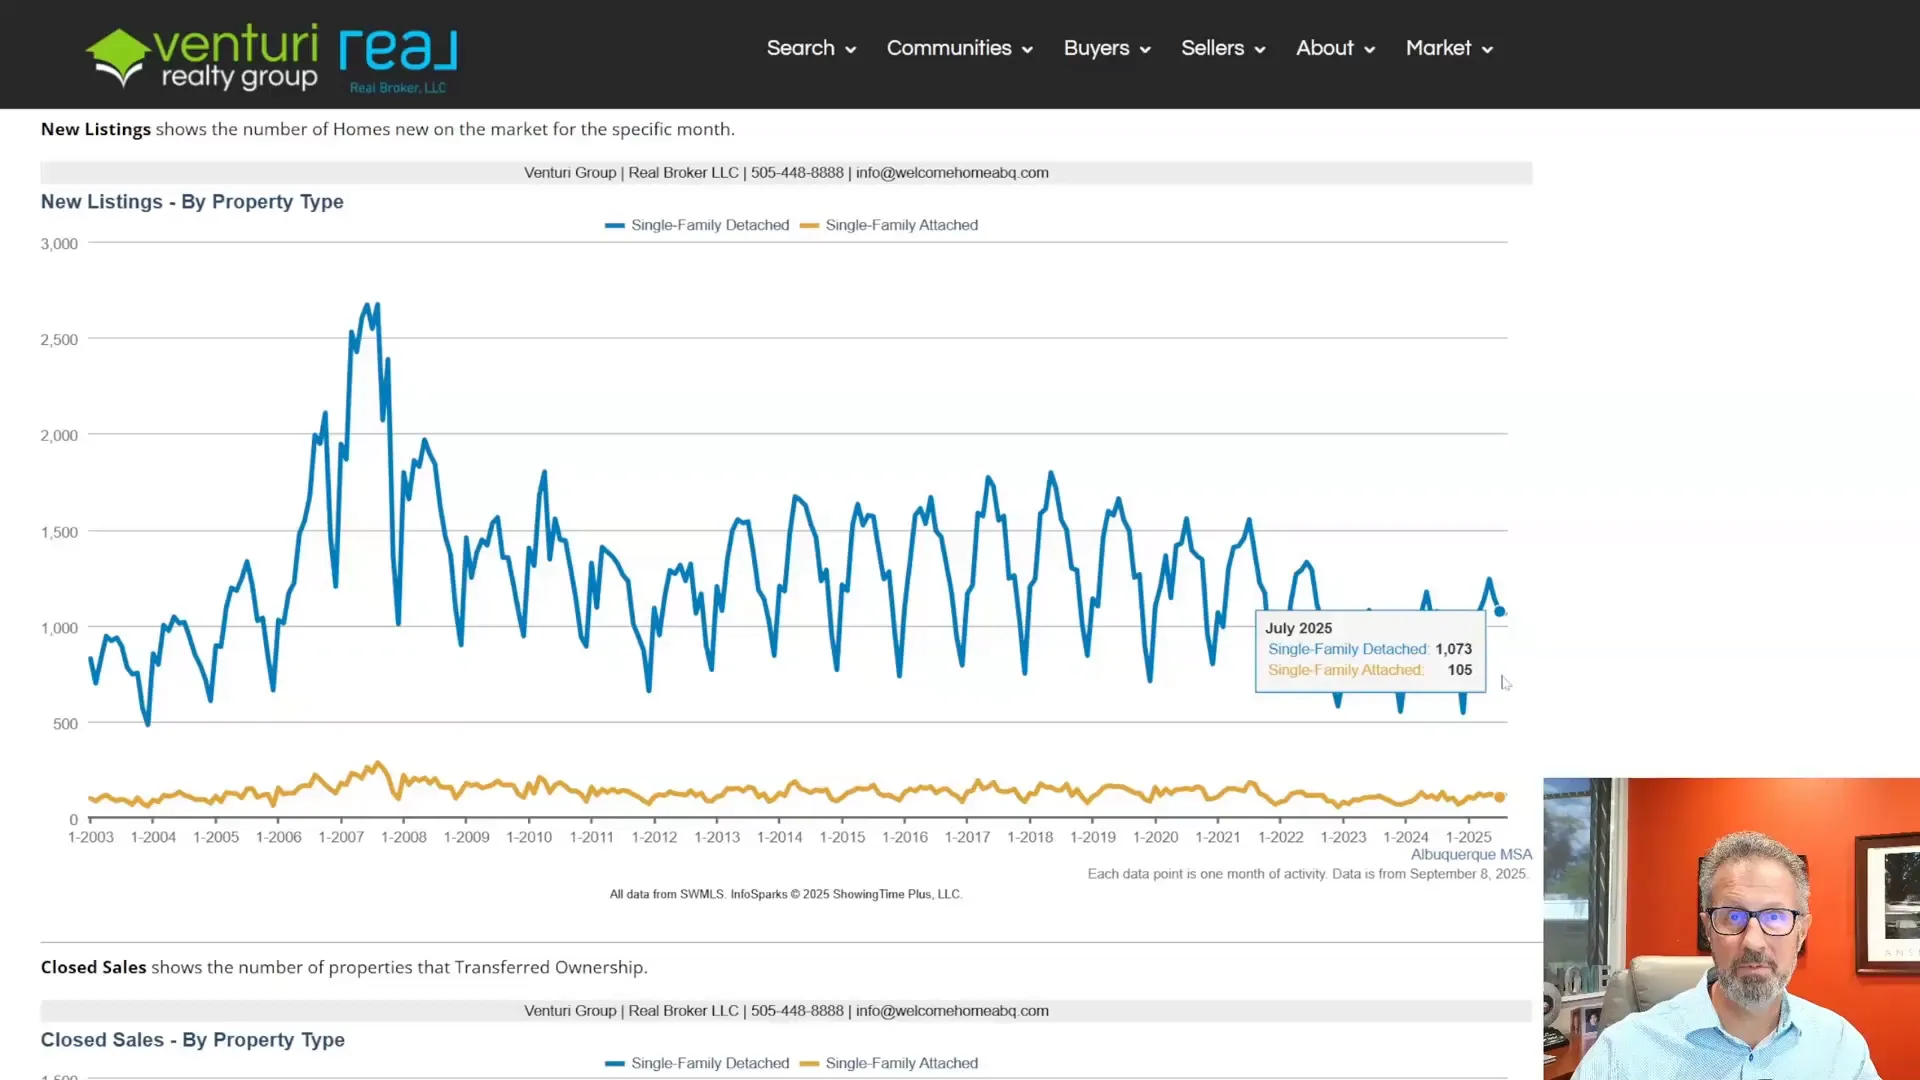
- New listings (Aug): 1,062 detached | 117 attached
Spring and early summer are the listing peaks. Many owners are “locked in” with low rates and comfortable payments, so they stay put. That keeps supply muted and shifts strategy toward presentation and pricing.
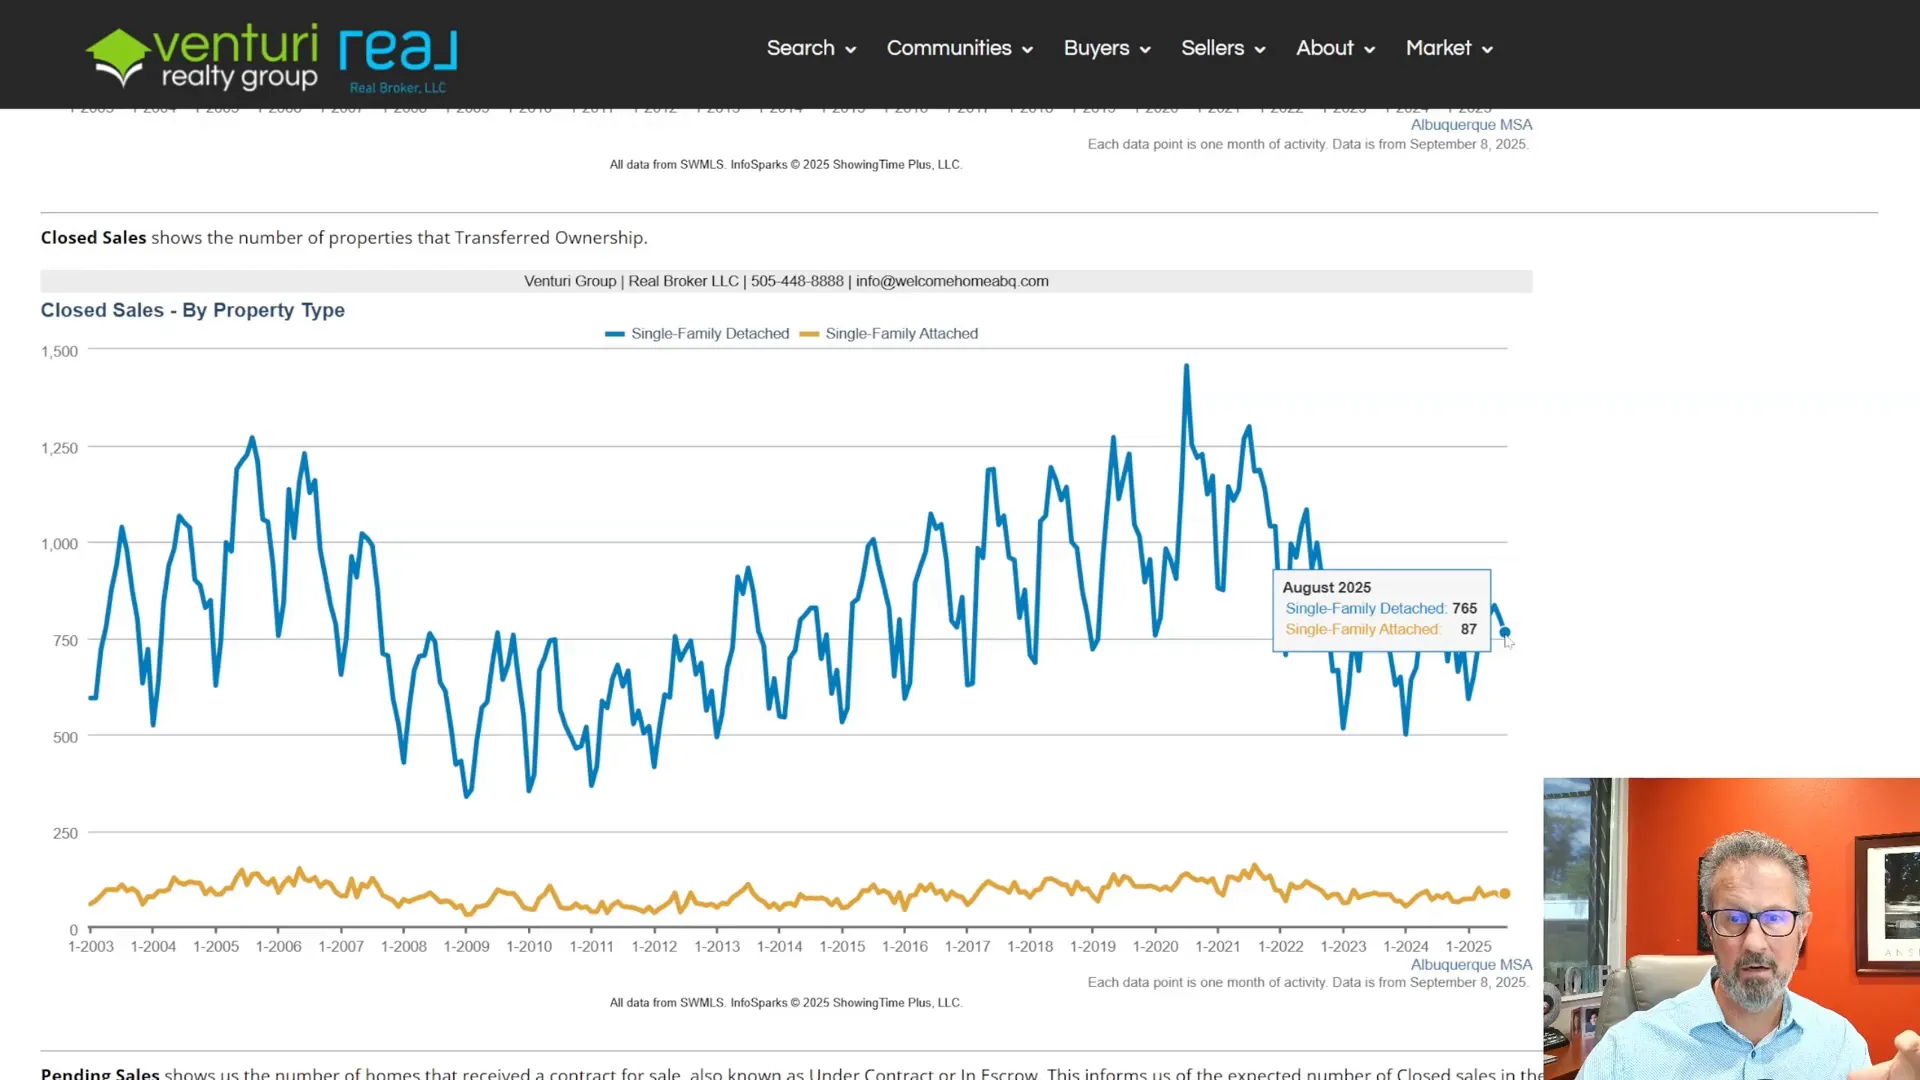
Closed & Pending Sales
- Closed (Aug): 770 Detached | 87 Dttached
Volume sits below 2015–2019 norms. Demand is steady, not “blowing the doors off.” Expect less frenzy, more normal negotiation.
Days on Market
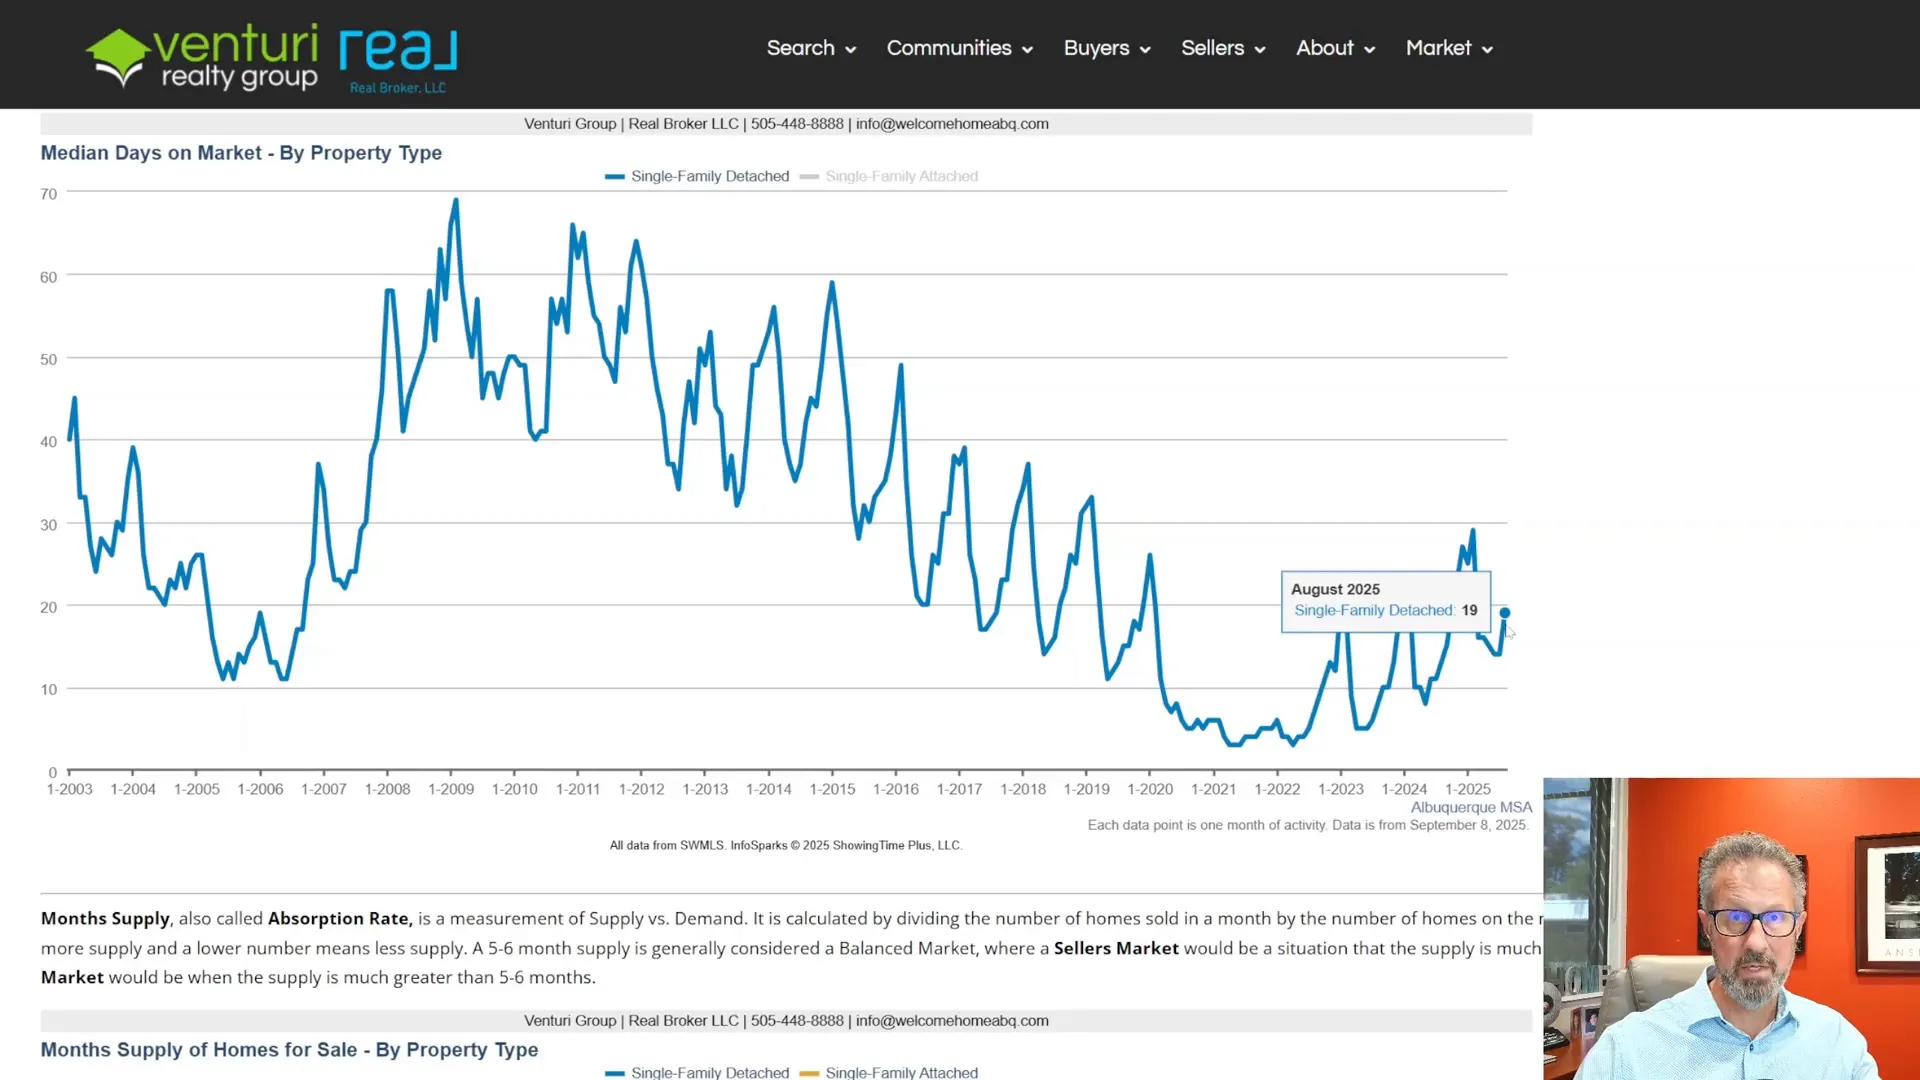
- Avg DOM (detached): 38 days
- Median DOM (detached): 19 days
Median under three weeks means well-priced, well-presented homes still move. The higher average is pulled up by lingerers. Plan accordingly.
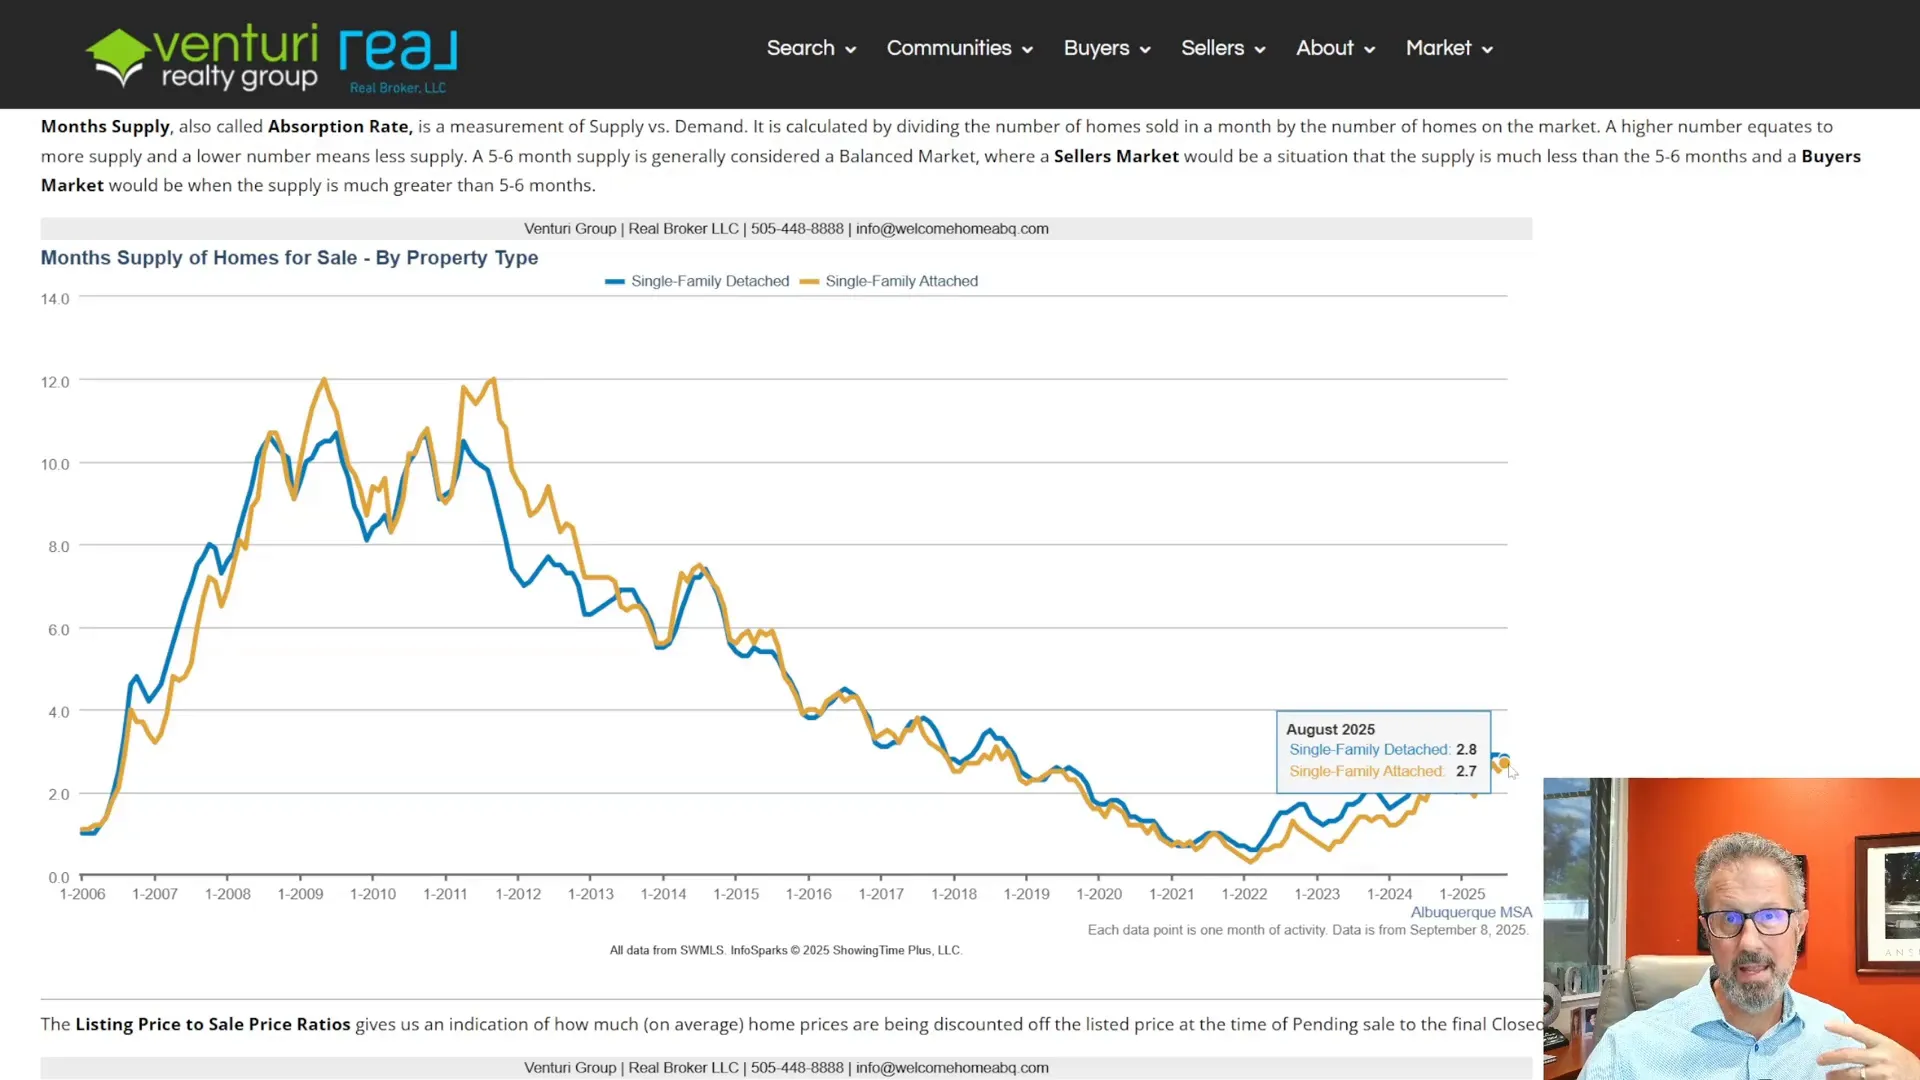
Months of Supply
- Detached: 2.8 months
- Attached: 2.7 months
Technically a seller’s market, but without 2021–2022 heat. Strategy and accuracy beat hype.
Discount off List Price
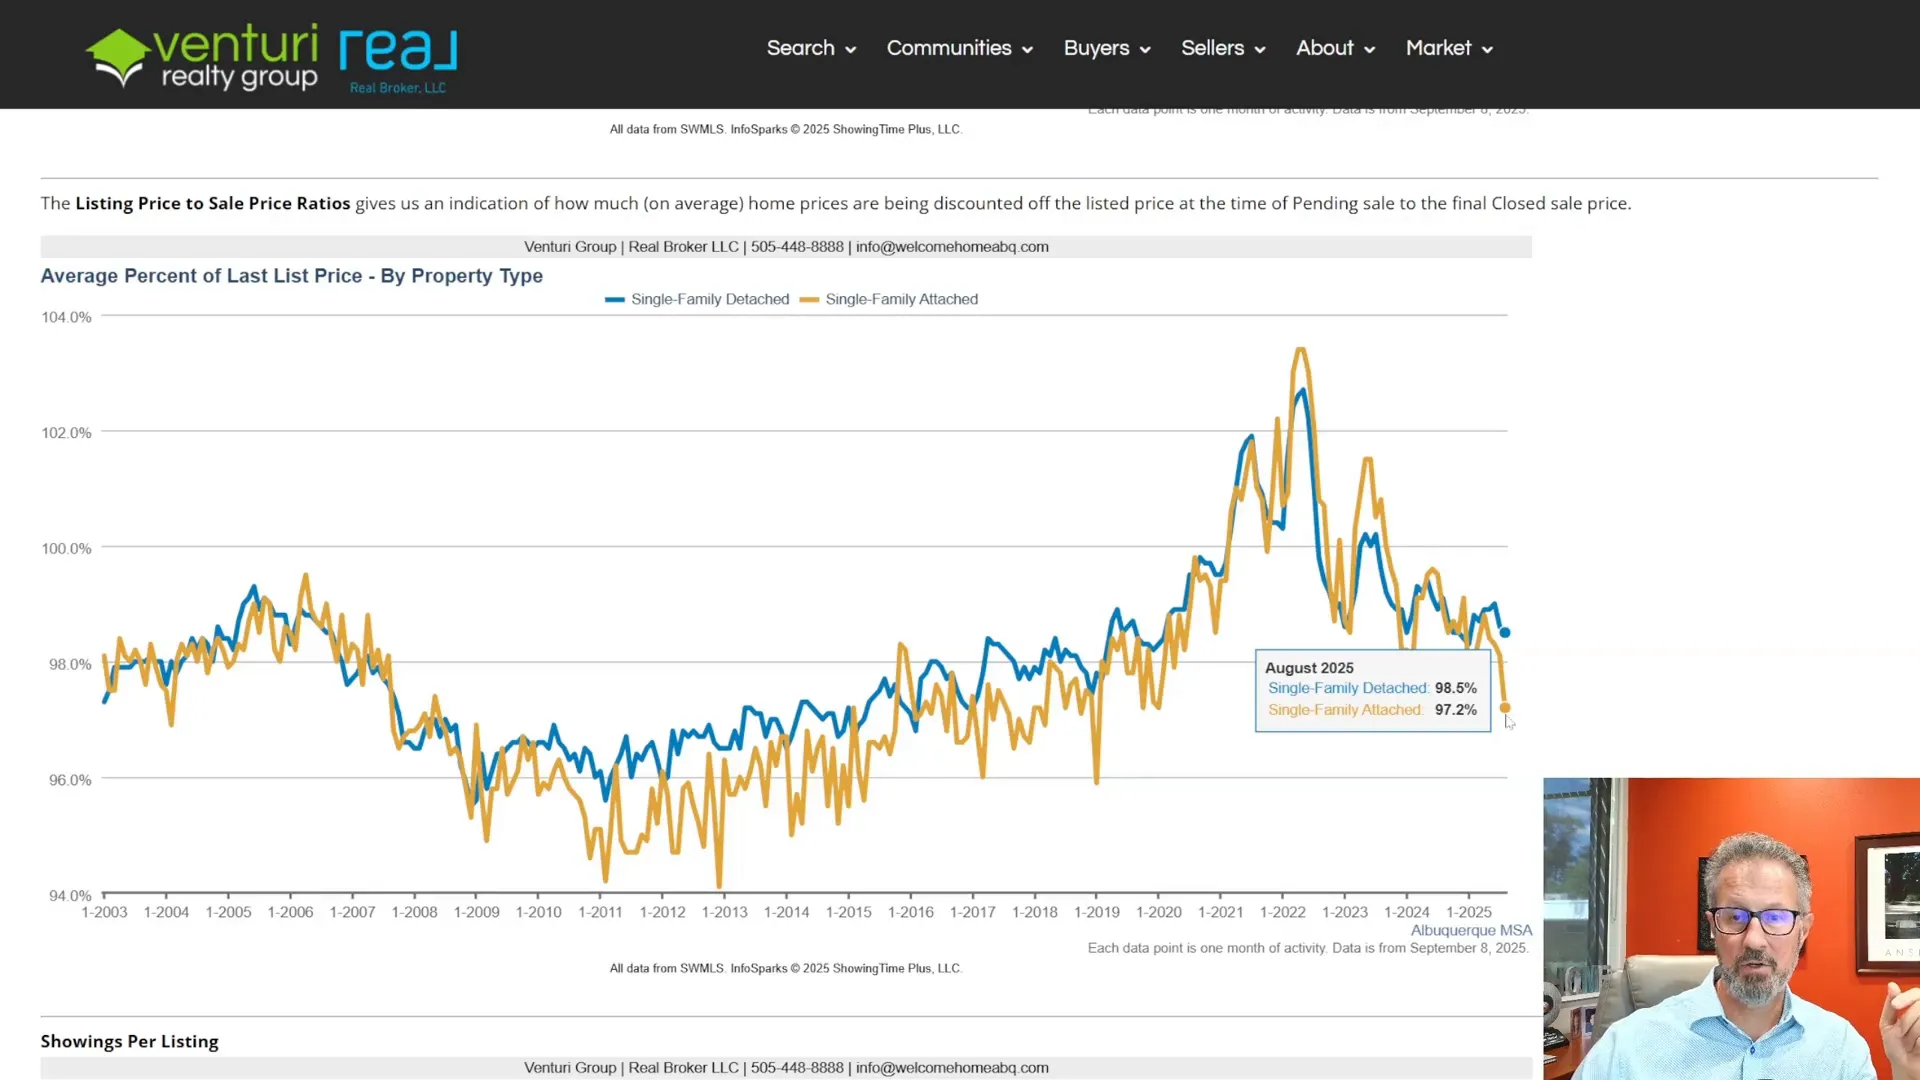
- Detached: ~98.5% of list (at contract)
- Attached: ~97.2% of the list
Mostly just under ask—very different from 2022’s 100%+ era, and similar to 2018–2019.
How I use the Trackers
I maintain a monthly tracker for the long view and a weekly tracker for the pulse. Example: for the week ending Sept 5, 2025 the weekly snapshot showed ~2,065 detached homes on market. Use these to watch how rates and seasonality move the numbers.
QuickTakeaways from the August 2025 Data
- Detached median price at a record; detached $/SqFt near peak.
- Inventory up from 2022 but still under some 2018–2019 levels.
- Sales volume below 2015–2019. Negotiation is back to normal.
- Median DOM is ~19 days; the average is 38, with pricing and presentation determining the speed.
- ~2.7–2.8 months of supply = seller-leaning, not overheated.
- Typical sale price is ~97%–98.5% of the list price, depending on the property type.
In short: a steady, healthy market that rewards good pricing, sharp marketing, and sensible negotiation.
Want this applied to your property?
Every neighborhood is its own micro-market. If you’d like a custom read – CMA, pricing plan, or buy-side strategy—call or text the Venturi Group at (505) 448-8888. We’ll map these trends to your goals.
Thanks for reading. I’ll keep the trackers current so you can follow along anytime.
Tego

