Albuquerque Housing Market Update – Long-Term Trends & Aug 2025 Data

Albuquerque Housing Market Update – Long-Term Trends & Aug 2025 Data

Albuquerque Housing Market Long-Term Snapshot — September 2025

This week, I stepped back from the month-to-month noise to show where Albuquerque stands over the long run. We’ll hit the key numbers—average and median prices, price-per-sq-ft, inventory, new listings, closed and pending sales, days on market, months of supply, and typical seller discounts—and turn them into practical guidance for buyers, sellers, and fellow agents. I’ll also point you to the weekly charts and trackers I use so you can follow along anytime.

Average sale prices in August 2025 for detached and attached homes in Albuquerque

Why look long-term?

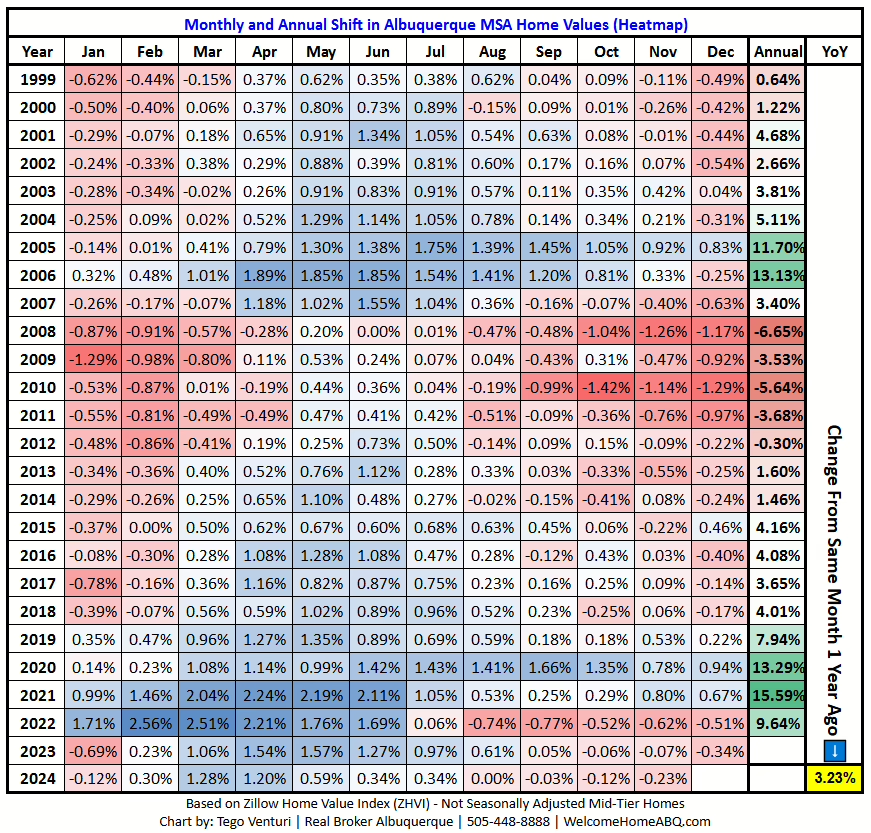
Monthly snapshots swing with seasonality. Long-term charts separate normal cycles from real shifts. When you zoom out, past 2022’s ultra-tight inventory and the oversupply of 2007–2008, you see where today’s market fits in relation to “normal.” Albuquerque has eased off the 2022 extremes, but is nowhere near the 2007–2008 glut. Prices are up modestly; the sales pace is slower than in several pre-pandemic years. 

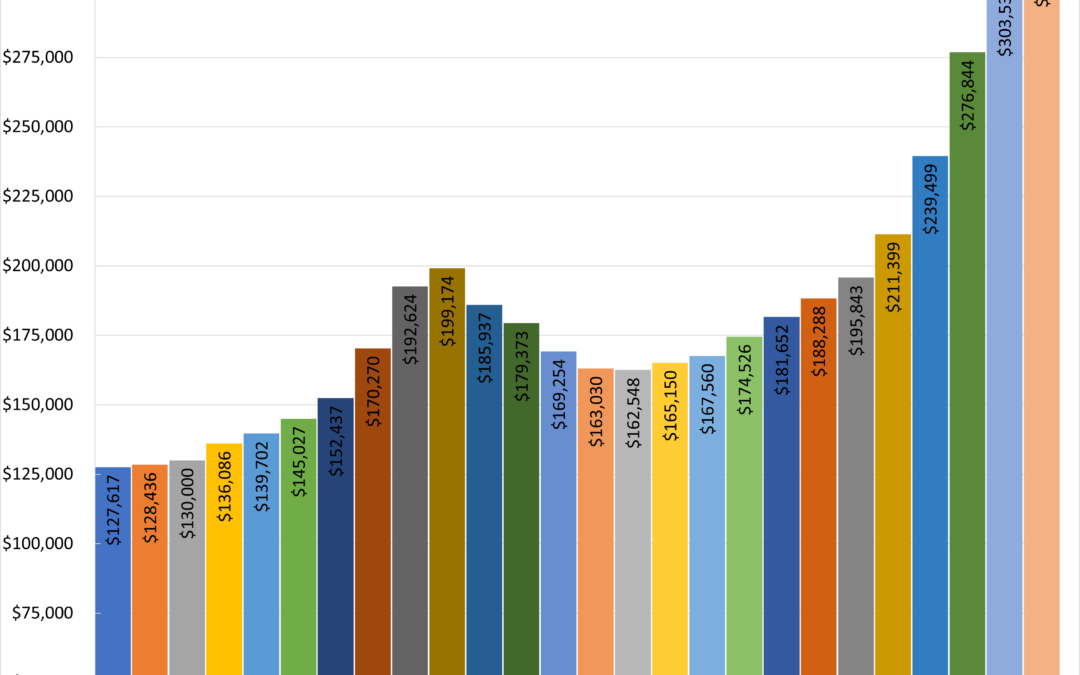
Prices: Average, Median, and $/SqFt

August 2025:

  • Average sale price (detached): $443,816
  • Average sale price (attached): $285,144
  • Median sale price (detached): $379,000 — a new high
  • Median sale price (attached): $279,000

Median price per square foot for attached vs detached homes

Two quick notes:

  1. Averages can get skewed by a few high or low outliers. I lean on the median for a cleaner read.
  2. Detached median at a record matters, even if averages wobble month to month.

$ / SqFt helps normalize for size:

  • Attached median $/SqFt: $207
  • Detached median $/SqFt: $216 (basically ties the March 2025 peak)

Bottom line: single-family values sit near record territory; attached homes remain a relative value. 

What it means

Sellers: Pricing can be confident but must be precise. Clean presentation still wins.
Buyers: Expect higher prices for detached homes vs condos and townhomes. However, be sure to compare attached homes, including association fees, as they can often be quite high.

Inventory: Choice vs. Leverage

Historic inventory path: 2007–2008, 2015–2019, 2022, and 2025

  • Average active in Aug: 2,108 detached | 218 attached

More choice than 2022. Still below 2018–2019. Far from 2007–2008. Translation: balanced-leaning-seller, not overheated.

Seasonality + the “Lock-In” Effect

New listings trend with clear spring/summer peaks

  • New listings (Aug): 1,062 detached | 117 attached

Spring and early summer are the listing peaks. Many owners are “locked in” with low rates and comfortable payments, so they stay put. That keeps supply muted and shifts strategy toward presentation and pricing.

Closed & Pending Sales

Monthly closed sales, detached vs attached

  • Closed (Aug): 770 Detached | 87 Dttached

Volume sits below 2015–2019 norms. Demand is steady, not “blowing the doors off.” Expect less frenzy, more normal negotiation. 

Days on Market

Average and median DOM for detached homes, August 2025

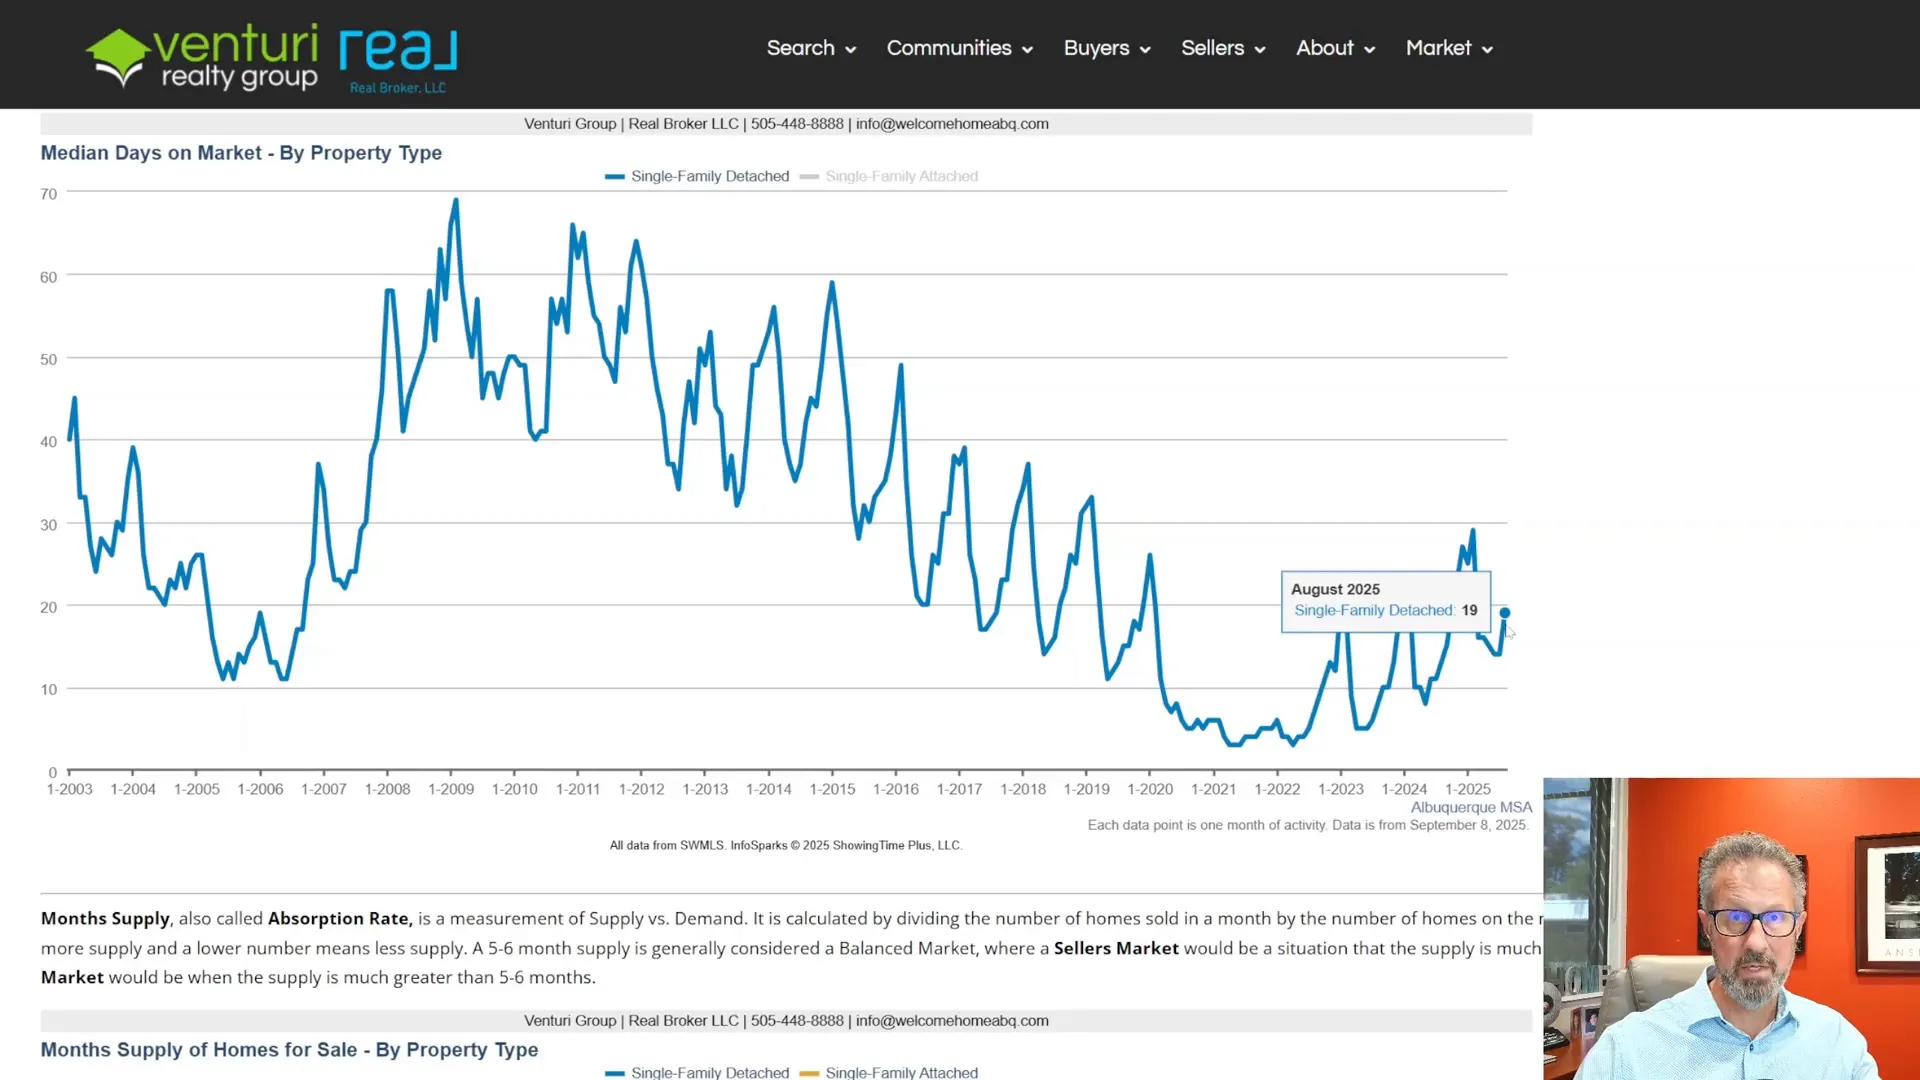
  • Avg DOM (detached): 38 days
  • Median DOM (detached): 19 days

Median under three weeks means well-priced, well-presented homes still move. The higher average is pulled up by lingerers. Plan accordingly. 

Months of Supply

Months of supply near 2.8 detached and 2.7 attached

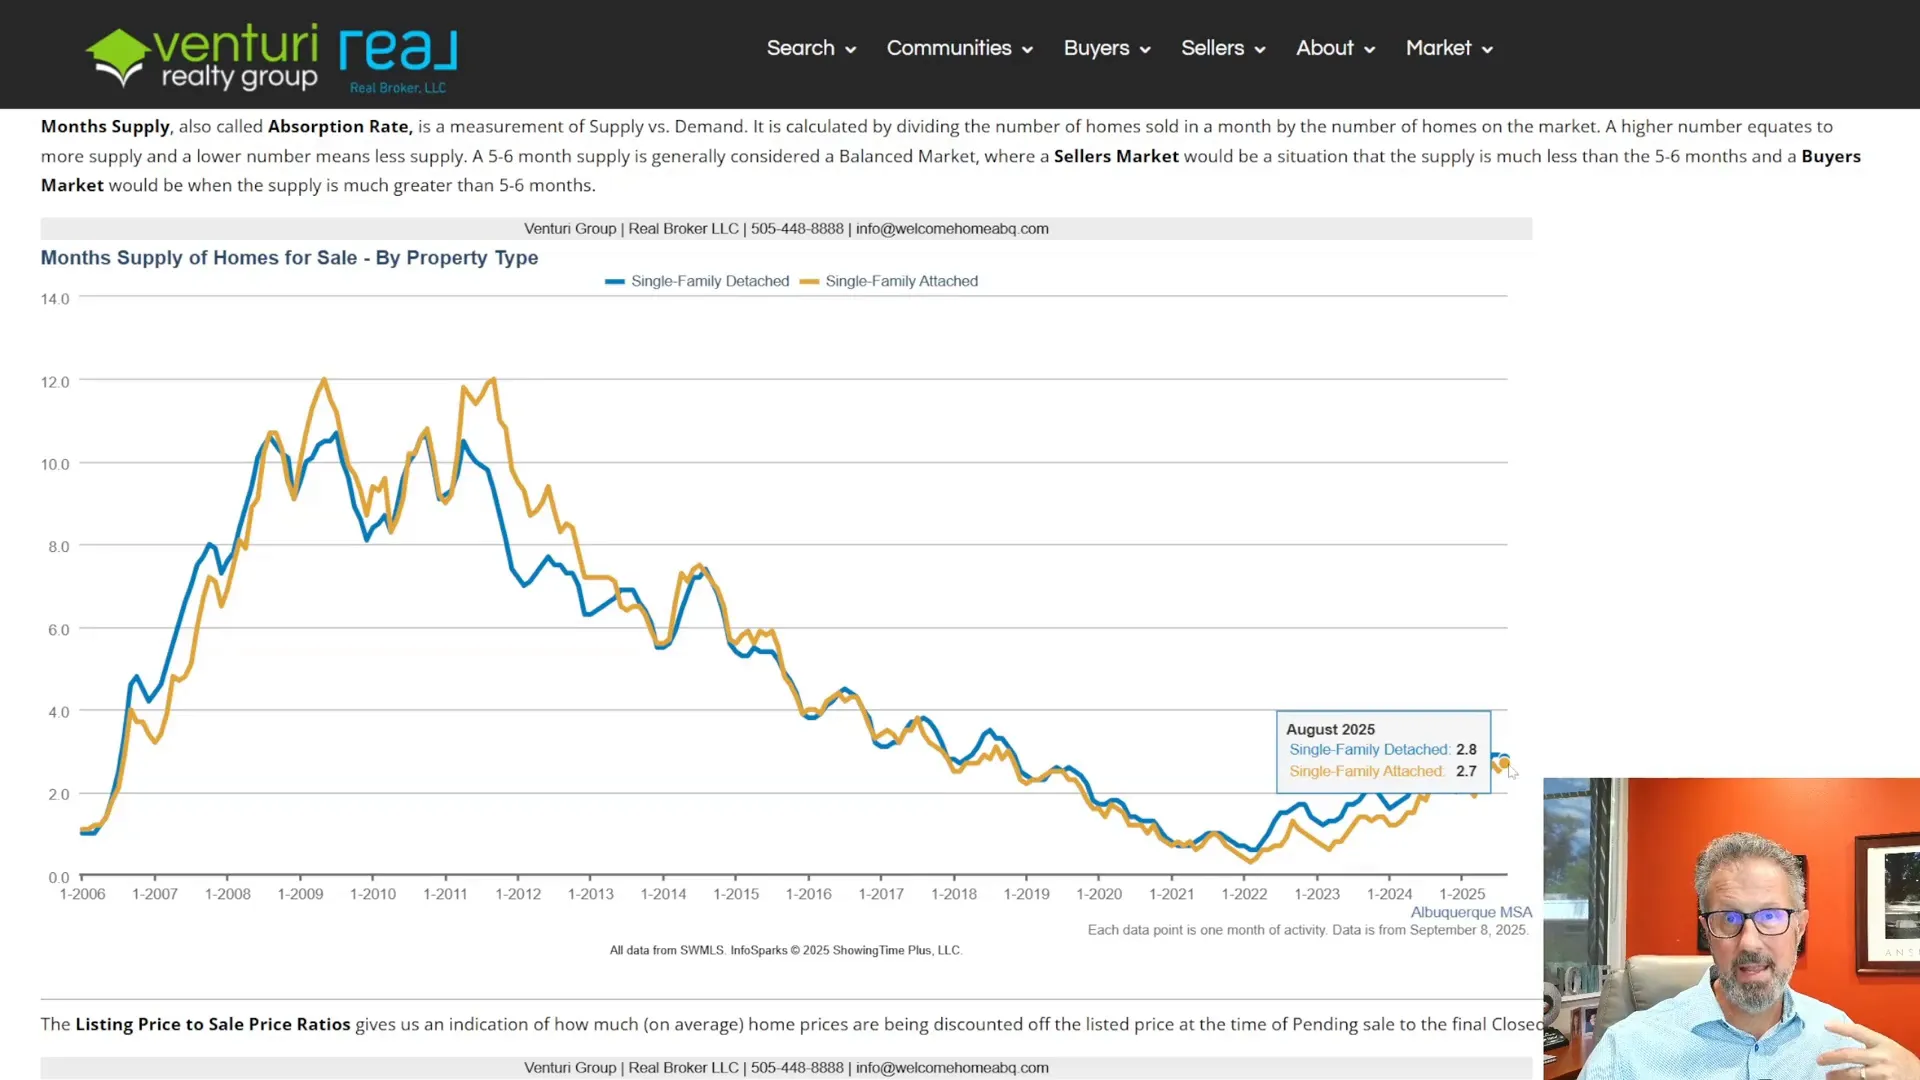
  • Detached: 2.8 months
  • Attached: 2.7 months

Technically a seller’s market, but without 2021–2022 heat. Strategy and accuracy beat hype.

Discount off List Price

Average percent of list price received

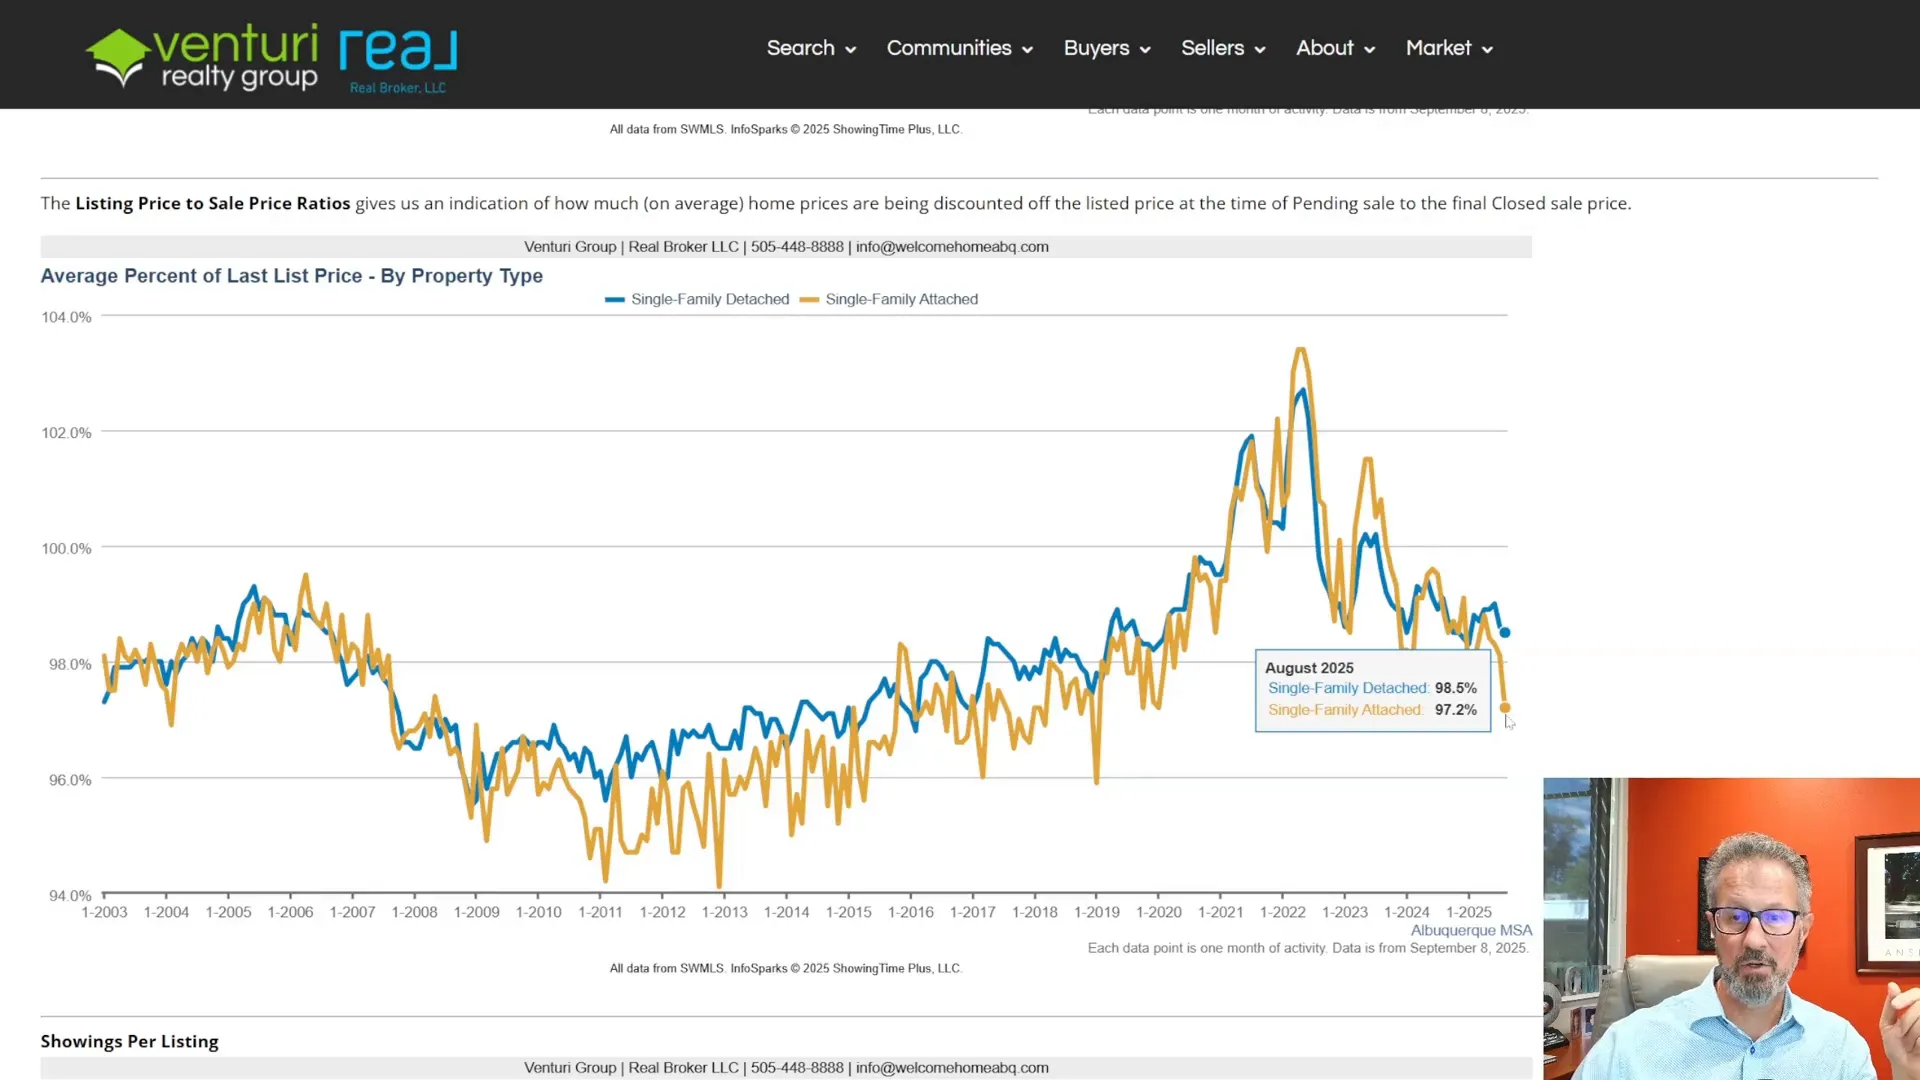
  • Detached: ~98.5% of list (at contract)
  • Attached: ~97.2% of the list

Mostly just under ask—very different from 2022’s 100%+ era, and similar to 2018–2019.

How I use the Trackers

Weekly tracker summary with current inventory read

I maintain a monthly tracker for the long view and a weekly tracker for the pulse. Example: for the week ending Sept 5, 2025 the weekly snapshot showed ~2,065 detached homes on market. Use these to watch how rates and seasonality move the numbers. 

QuickTakeaways from the August 2025 Data

  • Detached median price at a record; detached $/SqFt near peak.
  • Inventory up from 2022 but still under some 2018–2019 levels.
  • Sales volume below 2015–2019. Negotiation is back to normal.
  • Median DOM is ~19 days; the average is 38, with pricing and presentation determining the speed.
  • ~2.7–2.8 months of supply = seller-leaning, not overheated.
  • Typical sale price is ~97%–98.5% of the list price, depending on the property type.

In short: a steady, healthy market that rewards good pricing, sharp marketing, and sensible negotiation.

Want this applied to your property?

Every neighborhood is its own micro-market. If you’d like a custom read – CMA, pricing plan, or buy-side strategy—call or text the Venturi Group at (505) 448-8888. We’ll map these trends to your goals. 

Thanks for reading. I’ll keep the trackers current so you can follow along anytime.

Tego

Albuquerque Home Prices Q2 2025: FHFA Report Shows 4.5% Growth

Albuquerque Home Prices Q2 2025: FHFA Report Shows 4.5% Growth

Albuquerque Home Prices: Q2 2025 FHFA Report

The latest FHFA House Price Index shows Albuquerque home values still rising, outpacing the national average. Inventory is improving but remains below pre-pandemic levels, and affordability pressures are closely tied to mortgage rates.

Key FHFA Findings

  • Albuquerque home prices increased 4.5% year-over-year, compared to 2.9% nationally.
  • Quarter-over-quarter, Albuquerque gained 0.9% while the U.S. was flat.
  • Five-year appreciation: Albuquerque +57.7% vs U.S. +53.9%.
  • Since 1991: Albuquerque +311% vs U.S. +329%.
Albuquerque housing market report Q2 2025 FHFA home price index

Top 100 Markets By Size in the US Comparison One Year Home Price Appreciation 2025 Q2

Inventory and Market Dynamics

Active listings are up roughly 30% compared to 2024, but still about 10% below 2019. Buyers have more options than last year, but the market remains tighter than historical averages.

Because most homeowners hold low fixed-rate mortgages and have significant equity, home prices remain sticky. Even with affordability challenges, there are very few forced sales, which keeps values stable.

Albuquerque Homes For Sale Inventory Aug 2025
Compariring price vs interest rate

Affordability and Mortgage Rates

Affordability stress is increasing as mortgage rates stay in the mid-6% range. Housing costs now consume more than 30% of income for many households. Rates, however, matter more than small price changes.

Example: On a $350,000 loan, 7% interest = ~$2,329/month. At 6%, the payment drops to ~$2,099/month — a savings of about $230/month. That shift is more significant than a 5% home price reduction.

Homeowner Health and Market Stability

Delinquency and foreclosure rates remain near historic lows nationwide. Homeowners hold record levels of tappable equity, creating a strong cushion against distress and limiting forced sales.

New Mexico Mortage Delquiency rate 2.9% Foreclosures 0.5% of home with mortgage

Looking Ahead

The Zillow Home Value Forecast (ZHVF) projects Albuquerque Values will rise about +2.0% by mid-2026. Combined with FHFA data and low distress levels, the outlook suggests modest growth and continued stability, not broad declines.


About Venturi Realty Group

Tego & Tracy Venturi lead Venturi Realty Group at Real Broker, LLC — one of Albuquerque’s most experienced real estate teams. Known for market data insights, clear communication, and thousands of successful transactions, they are consistently recognized among the best real estate agents in Albuquerque.

The team also hosts the Albuquerque Real Estate Talk radio show and podcast, helping buyers and sellers stay informed on local housing trends, home values, and market conditions.

Albuquerque Home Prices & Values – August 2025 Update

Albuquerque Home Prices & Values – August 2025 Update

Albuquerque Home Prices & Values – August 2025 Update

The Zillow Home Value Index (ZHVI) tracks the estimated value of every home, sold or not, giving a reliable view of where prices are heading.
Individual Zestimates can vary, but in aggregate, the trend data for the Albuquerque area is a strong market gauge.


Quick Snapshot – July 2025 Albuquerque Home Values

Metric Value Change vs. June 2025 Change vs. July 2024
Typical Albuquerque Home Value (ZHVI) $346,000 +0.12% +1.84%

Key takeaway: Values are up modestly year-over-year, with lighter-than-usual month-to-month gains for this time of year.


From 1999 through July 2025, Albuquerque shows steady long-run appreciation with normal cycles.
Historically, June→July averages +0.71%; in 2025, it was +0.12%, indicating slower seasonal appreciation this year.

Monthly percent change in Albuquerque home values, 1999–2025, showing slower-than-average June-to-July 2025 gain.


Monthly percent change in Albuquerque home values, 1999–2025, showing slower-than-average June-to-July 2025 gain.


How Albuquerque Compares Nationally

  • Albuquerque: +1.8% YoY
  • Stronger metros: Hartford (~+4.5%), Detroit (~+4%), Rochester (~+4%)
  • Weaker metros: Many Florida metros (~−10%), Austin (~−6%)
  • One-year change in metro-level home prices between July 2024 and July 2025

Real estate is local. Albuquerque is outperforming several Southwest peers (e.g., Phoenix down, El Paso near flat).


12-Month Forecast

Zillow’s outlook places Albuquerque in the Top 10 for expected appreciation:

+2% over the next year vs. +0.4% nationally. Interactive chart HERE

One Year Home Value Forecast - Largest 100 US Markets - July 2025 to July 2026
The local projection ticked up from ~+1.5% last month. El Paso is similarly projected around +2%.


Market Pace & Sales Volume

  • Projected 2025 sales: ~10,000 homes (vs. ~15,000 in 2021)
  • Inventory: Still below 2019 levels, which supports prices despite slower activityAnnual Closed Home Sales Albuquerque Area


FAQs: Albuquerque Home Values

What is the typical home value in Albuquerque right now?

The ZHVI shows $346,000 for July 2025.

Are Albuquerque home prices rising or falling?

Rising modestly: +1.84% year-over-year, but slower month-to-month than the long-run average.

How does Albuquerque compare to the U.S. overall?

National forecast is ~+0.4%; Albuquerque is projected at +2% from July 2025 to July 2026, among the stronger markets.

Why use ZHVI instead of recent sales only?

ZHVI tracks every home (sold or not), giving a broader read on local value trends, not just sale price trends.

Is it a buyer’s or seller’s market?

Closer to balanced than we have seen since 2019. Limited inventory still gives sellers leverage; buyers have more choice than during the boom. However, it will depend on the home price point, home condition, and location.

Local Insight

Albuquerque has been resilient. The market is steady, not surging. Sellers should price strategically. Buyers should act on well-priced homes while selection is better than in prior boom years.


Albuquerque Home Values Update – November 2024

Albuquerque Home Values Update – November 2024

Albuquerque Home Values Update: November 2024

The Albuquerque housing market continues to demonstrate steady growth, making it one of the top-performing real estate markets in the U.S. for the next year. According to the Zillow Home Value Index (ZHVI), the typical home value for the Albuquerque Metropolitan Statistical Area (MSA) reached $334,538 in November 2024. This represents a 3.23% increase year-over-year from November 2023 and a slight 0.23% decrease month-over-month from October 2024.

Additionally, the Zillow Home Value Forecast (ZHVF) predicts a 3.9% increase in home values in Albuquerque over the next year (November 2024 to November 2025). This strong forecast places Albuquerque in the top 10 markets for home value appreciation among the 100 largest U.S. metro areas.

Key Market Highlights: November 2024

  • Current Home Values (ZHVI): The typical home value in the Albuquerque MSA is $334,538, reflecting 3.23% growth year-over-year, while slightly cooling seasonally with a 0.23% decline month-over-month.
  • Zillow Home Value Forecast (ZHVF): Albuquerque is forecasted to see 3.9% home value appreciation over the next year, ranking among the top 10 metro areas for projected growth.
  • Seasonal Trends: Seasonal cooling is reflected in the November data, following typical trends as demand softens during fall and winter.

Interactive Market Data: Albuquerque ZHVI

To get a more dynamic perspective of Albuquerque’s housing market trends, explore the Datawrapper chart below. This chart tracks the Zillow Home Value Index (ZHVI) over time, giving you an interactive way to visualize historical and current changes in home values.

Historical Home Value Trends

For a comprehensive look at Albuquerque’s market history, the heatmap below details the monthly and annual shifts in home values from 1999 to 2024, as measured by the ZHVI. This heatmap highlights Albuquerque’s cyclical market trends, showcasing the impact of economic events like the 2008 housing crisis and the post-pandemic surge.

Albuquerque Home Values Index Nov 2024

Insights From the Heatmap

  • Pandemic Boom: Albuquerque experienced significant home value growth during 2020-2022, with a record-breaking 13.29% year-over-year appreciation in 2021.
  • Market Moderation in 2024: While home values continue to rise, the 2024 heatmap reflects a slower pace of appreciation than the pandemic years. Seasonal declines, like the 0.23% drop in November, are consistent with typical market patterns.
  • Great Recession Impact (2008-2010): The Albuquerque market faced significant declines during the housing crisis, with home values falling by as much as 6.65% annually in 2008. The recovery since then has been consistent and steady.

Looking Ahead: Albuquerque’s Housing Market in 2025

Albuquerque is projected to experience a 3.9% appreciation in property values over the next year, indicating steady and moderate growth in 2025. The city's comparative affordability, consistent demand, and historically stable market make it an attractive destination for both buyers and investors. While seasonal trends will likely lead to short-term fluctuations, the long-term outlook remains positive.

Get the Latest Albuquerque Housing Market Insights

Whether you’re looking to buy, sell, or invest, understanding market trends is essential for making informed decisions. For expert advice and personalized insights, contact The Venturi Group of Real Broker Albuquerque at 505-448-8888. Let our team help you navigate Albuquerque’s dynamic housing market with confidence.

We also have Real-Time Albuquerque Housing Market Trends for a week look at the Albuquerque Real Estate Market Trends.


Albuquerque Real Estate Market Report: May 2024 Update

Albuquerque Real Estate Market Report: May 2024 Update

Unveiling the Albuquerque Housing Market Trends - May 2024 Update

Are you curious about the current state of the housing market in Albuquerque, New Mexico? In this video, I provide you with the latest data and trends as of May 2024. My goal is to bring you an insightful market update to keep you informed about what’s happening in the real estate sector.

Introduction

In May 2024, the Albuquerque housing market is active. I analyze the latest sales data, prices, and trends. Let’s examine the details to give you a comprehensive overview.

30-Year Fixed Rate Mortgage Trends

The market has seen fluctuations in mortgage rates, with a one-year trend showing ups and downs. From a peak of over 8 percent in November to just over 7 percent currently, predicting mortgage rates remains a challenging feat.

April Market Data Overview

Analyzing the monthly data for home sales in Albuquerque, the numbers reveal a 14 percent increase in homes sold compared to last year. While the lower price range has witnessed a decrease in available homes, the luxury market (priced at $600,000 and above) has experienced a notable uptick. In the video, I shed light on the market dynamics across different price segments.

Long-Term Trends in Home Inventory

Delving into the historical data, there has been a gradual increase in the number of homes available for sale over the years. However, comparing the current inventory to 2019 levels, Albuquerque still lags behind other markets in terms of housing supply. I draw parallels to national trends to provide a broader context for understanding the local market dynamics.

Pending Sales and New Listings

With a significant 18 percent increase in pending sales from the previous year, Albuquerque is witnessing a surge in buyer activity. However, the challenge lies in the limited new listings entering the market, especially in the lower price points. I explain the complexities of the market dynamics impacting new listings and pending sales.

Supply-Demand Dynamics and Price Trends

The supply-demand ratio indicates a seller’s market, with varying months of supply across different price ranges. Homes under $400,000 continue to attract buyers swiftly, showcasing sustained demand in that segment. I discuss the average days on the market and showings per listing to gauge buyer interest levels and market activity.

Median Sale Prices and Price Per Square Foot

The median sale price for homes sold in April is $345,000, reflecting a steady rise in property values. The price per square foot has also seen a notable overall uptick of 8.9% vs April 2023, especially in the lower price points, underlining the robust demand in those segments. I provide insights into the price trends and their implications for buyers and sellers.

Zillow Home Value Index and Future Outlook

The Zillow Home Value Index indicates an all-time high in average home prices for Albuquerque, signaling a strong market performance. I hint at a potential shift in price dynamics moving forward, with projections of a more stabilized market in the coming months. As the market evolves, staying informed about the latest trends is crucial for making informed real estate decisions.

Conclusion

As we wrap up the Albuquerque Housing Market Update for May 2024, I offer a comprehensive analysis of the current trends and data shaping the real estate landscape. Whether you’re a buyer, seller, or simply curious about the market dynamics, staying abreast of the latest information is key to navigating the Albuquerque housing market effectively. For more insights and personalized real estate assistance, reach out to the Venturi Group with Real

Broker in Albuquerque, New Mexico.

Thank you for joining me on this insightful journey through the Albuquerque housing market. Stay tuned for more updates and analyses to help you make informed decisions in the dynamic real estate landscape.

Albuquerque Home Values – The 25 Year Journey

Albuquerque Home Values – The 25 Year Journey

Albuquerque Home Values – The 25 Year Journey

The Albuquerque housing market has undergone some ups and downs over the past 25 years, yet despite these changes, the long-term trend has consistently shown stable upward growth in values. We dug into the annual year-end readings from the Zillow Home Value Index data, and this is what we found.

In 1998, the average Albuquerque home value stood at a modest $127,617. Over the past 25 years it has increased 151% to $321,306. The growth mirrors not just Albuquerque’s real estate market but also the complex interplay of economic forces and changes over the past 25 years.

The initial years of the period, late 1990’s, were characterized by moderate and consistent growth and stability.

Starting in 2000, Albuquerque home values experienced sharper increases in value, with significant value increases in 2005 and 2006, mirroring the nationwide housing bubble that eventually led to the 2008 Global Financial Crisis (GFC).

While the years from 2008 to 2012 presented significant challenges, it is worth noting that the Albuquerque area managed to weather the storm better than others, avoiding the severe declines witnessed in some cities throughout the country.

Home values started to recover in 2012 and continued to have average value increases until 2018. Starting in 2019 and accelerating in 2020, there were significant annual increases in home values peaking with the largest one year increase in 2021 at 15.5%. In 2023, there was a moderate gain of 5.85% in line with the overall economic conditions in the US and New Mexico.

The recent surge in housing prices is the result of several factors, such as historically low-interest rates from 2020 to 2022, a restricted housing supply causing a mismatch between supply and demand, and shifts in housing demand due to the pandemic.

The annual percentage change in Albuquerque home values serves as a powerful indicator of the economic vitality of the region. There have been periods of significant growth, declines post-GFC, along with smaller increases in some years, all influenced by local, national, and global economic trends and policies.

In Albuquerque, home values have seen an average annual increase of 3.76% over the past 25 years. And in the last decade, after the GFC, there has been a 6.5% annual growth in home values.

** The average December value of all single-family homes in the Greater Albuquerque area. Sourced from the Zillow Home Value Index (ZHVI) and represents the “typical” home by including properties in the 35th to 65th percentile range for value.