

Start with your area and your budget
Albuquerque can offer buyers more negotiating room in one price range while sellers still face little competition in another. The useful question is how much choice buyers have for the kind of home you’re considering, in the area where you’re looking.
Tracy and Tego Venturi make that distinction in Albuquerque Real Estate Talk, Episode 605. Use the live comparison below to explore the same idea, then follow their on-screen examples to understand why the numbers can tell different stories.
Your market, this week
Compare the places you’re considering
Choose two ZIP codes and a target price. The tool retrieves the latest available Altos Research reports, shows where your target sits in each market, and explains the differences. Open it on its own to share the comparison without the rest of this article.
Open the comparison tool on its own ↗ · Updated source dates appear inside the tool. ZIP codes and price quartiles are broader than the exact MLS neighborhood searches in the episode.
Check what the inventory number counts
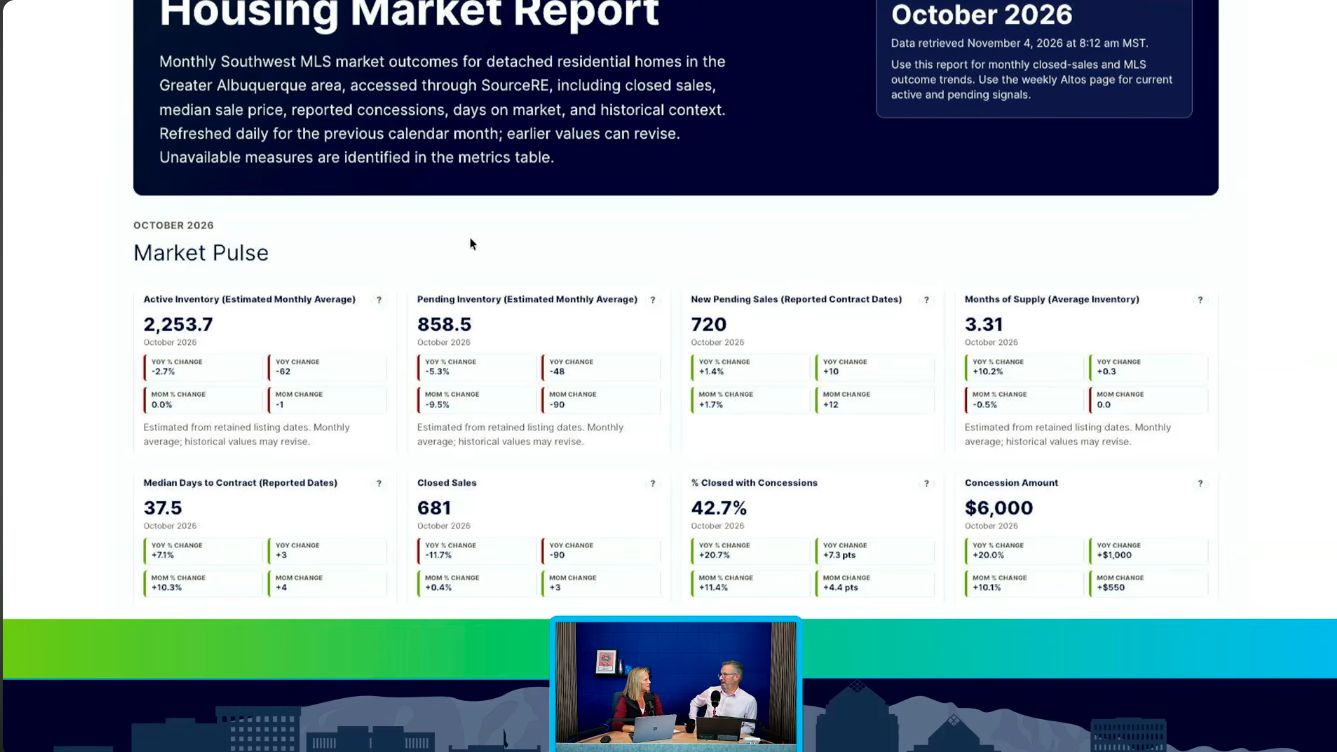
Early in the episode, Tego opens the monthly Southwest MLS dashboard. Later, his supply slides use an active-inventory snapshot and three months of closings. A monthly average and a single-day count can differ even when both are describing inventory accurately.
Keep the geography, property type, price range, and measurement period together. That is also why the tool labels its weekly active-listing figures rather than silently replacing the figures in the show.
Why “buyer’s market” needs a little more detail
A buyer might have a long list of alternatives in one part of Rio Rancho, while another buyer struggles to find a home in their Albuquerque price range. Both can be describing the market accurately.
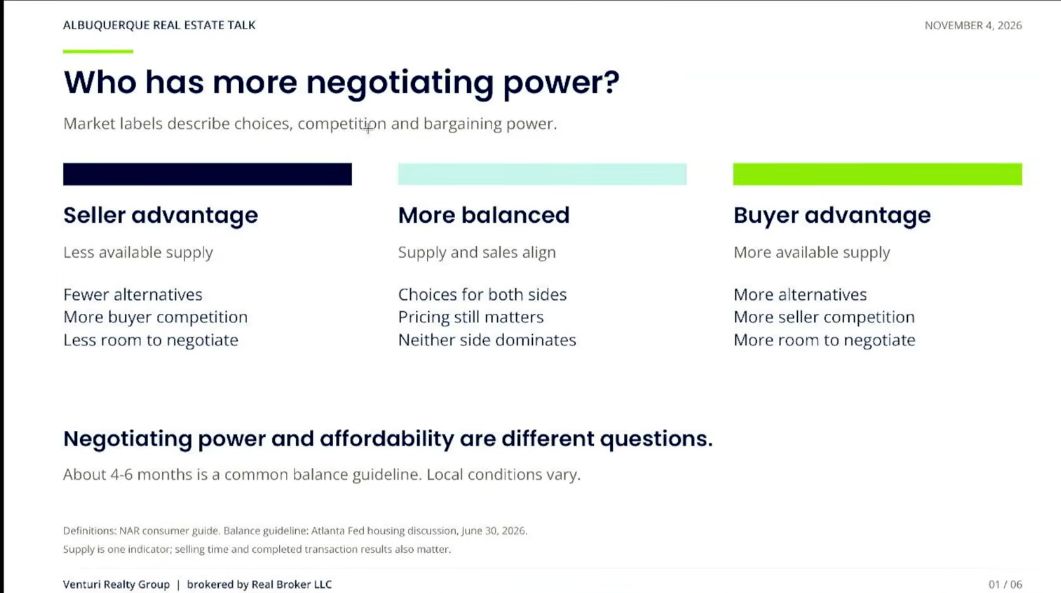
Tego’s point is that a metro average blends those experiences together. A seller’s advantage usually means fewer competing homes relative to demand. More available choices can give buyers room to compare, ask questions, and negotiate. Neither label tells you whether the payment fits your budget or whether a particular home is priced well.
The graphic he shared makes that separation especially clear: negotiating power and affordability are different questions.
Months of supply measures the balance, not a selling deadline
Counting listings tells us how much is available. To understand whether that is a lot or a little, we also need the pace of sales.
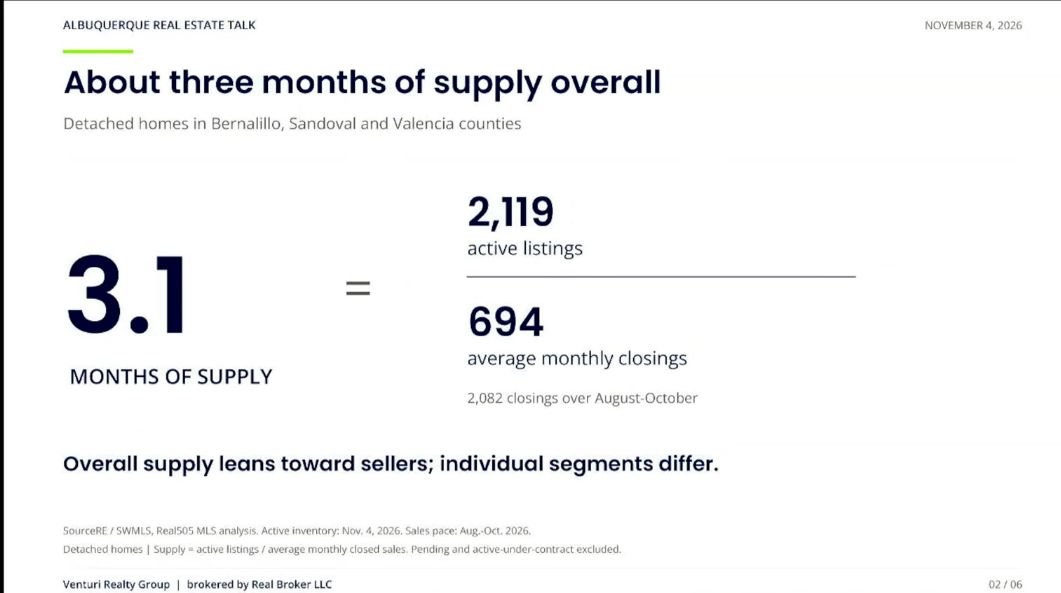
Months of supply divides active inventory by average monthly closed sales for the same market segment. If no new homes were listed and the recent sales pace continued, it estimates how long that supply would last. It does not predict how many months a particular home will take to go under contract.
In Tego’s November 4, 2026 example, 2,119 active detached listings divided by 694 average monthly closings produces about 3.1 months of supply. His slide uses detached homes in Bernalillo, Sandoval, and Valencia counties, with the sales pace measured over August–October.
That definition also explains why the live tool uses a different label for Altos’s Market Action Index. It is a supply-and-demand signal with its own scale, rather than a count of months. We keep it separate from inventory, active days on market, and asking-price reductions so each number answers the question it actually measures.
The same budget can face very different competition
The most revealing comparison in the episode holds the asking-price range steady: $500,000–$749,999 for detached homes. Albuquerque Acres West had 16 active listings and 20 recent closed sales. Rio Rancho North had 50 active listings and 24 recent closed sales.
With three months of closings in the calculation, Albuquerque Acres West came out to 2.4 months of supply. Rio Rancho North came out to 6.3. The greater supply in Rio Rancho North came from having many more listings relative to a similar recent sales count.
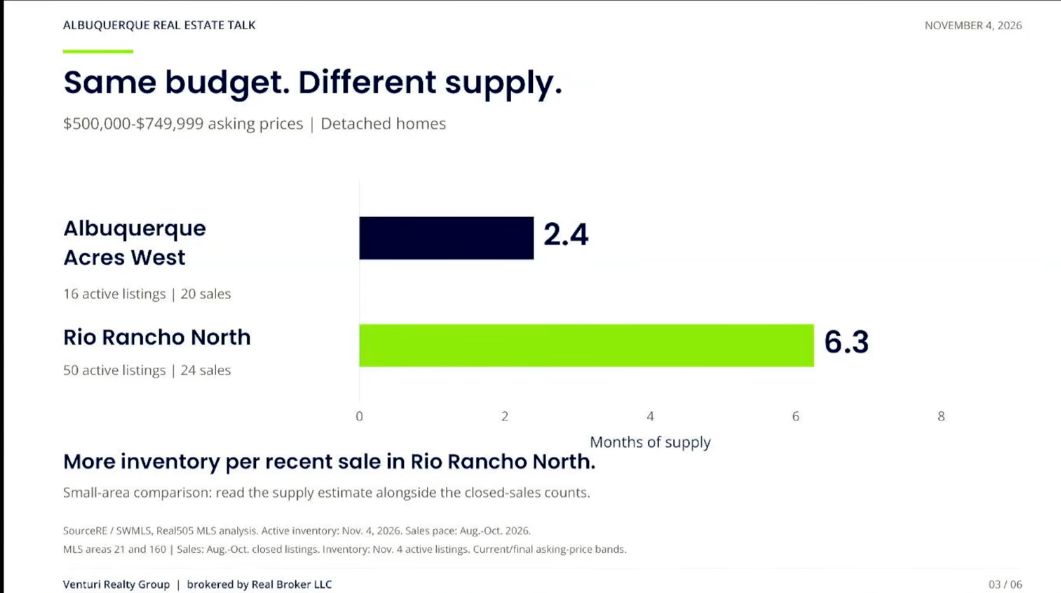
That is why a broad headline can be a poor starting point for an offer or a listing price. A buyer needs to know the alternatives to this home. A seller needs to know which homes compete for the same buyers.
The live tool applies that reasoning at the ZIP-code level. A $625,000 target, for example, may sit in a different price quarter in each ZIP. It displays both actual price spans so you can see that limitation. For an exact neighborhood and dollar range, the next step is a matching MLS analysis.
Price changes the picture, even before location does
Tracy brings examples from the Northeast Heights, Rio Rancho, Los Lunas, and Placitas into the conversation. Each has to be read with its own price range. Her narrower examples are useful precisely because they describe different slices of the market.
Tego then pulls the camera back to detached homes across the three counties. His price-range graphic moves from about 2.0 months of supply below $300,000 to 7.6 months at $1 million and above.
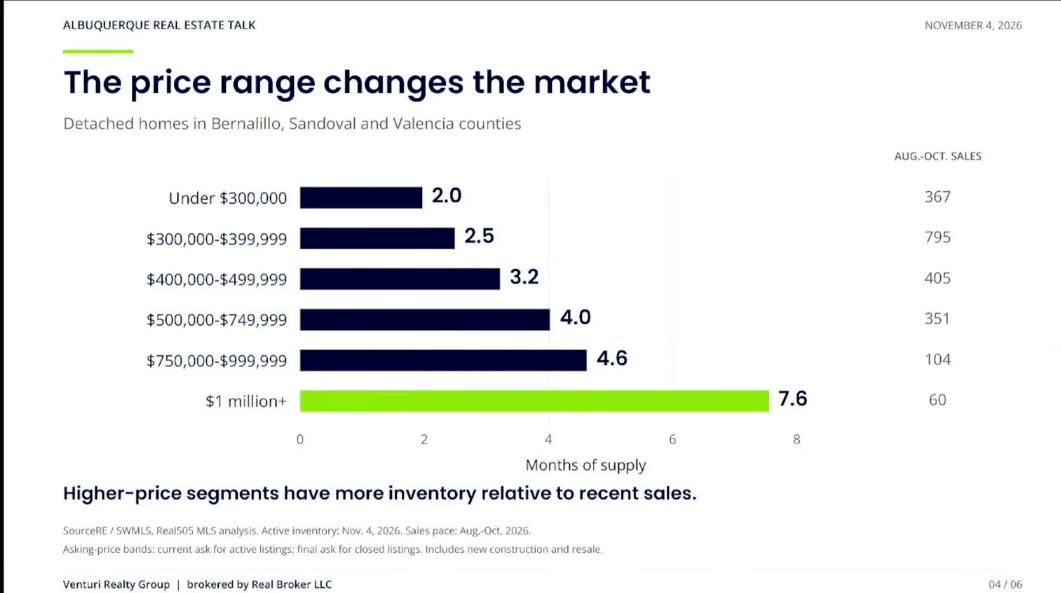
A relative price quarter in Altos is not a fixed dollar bracket. The most expensive quarter in one ZIP may overlap the middle of another. Read the actual ranges before deciding that two groups represent the same choices. The count matters, too: a small group can change sharply when only a few homes are listed or removed.
A price reduction doesn’t settle the home-value question
A seller can reduce an ambitious asking price while nearby completed sales or a broader home-value index show a different trend. Those observations measure different things.
The show’s illustration starts with a hypothetical $600,000 asking price, changes the ask to $550,000, and ends with a $545,000 sale. That sale is about 99.1% of the final ask, but 90.8% of the original ask. Choosing a different benchmark changes the story without changing the transaction.
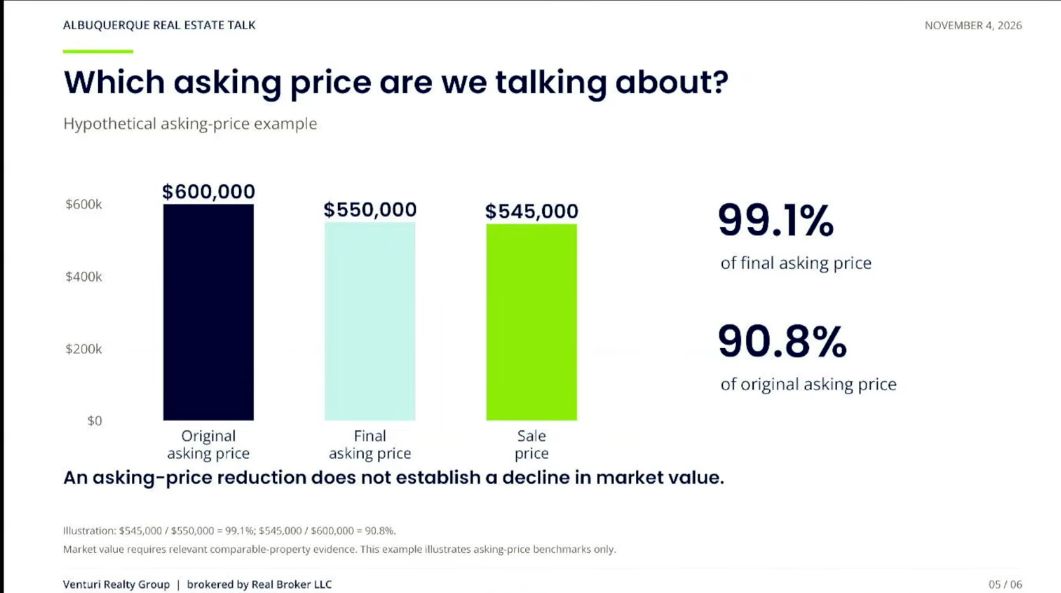
For the live comparison, “asking price reduced” is a prompt to look more closely at pricing and condition. It does not establish how much a home is worth, how much a seller will accept, or how completed-sale values have changed.
Tego also opens the Zillow Home Value Index on the show. The September 2026 dashboard he displays reports an Albuquerque MSA annual increase of about 1.39%, alongside a monthly change of −0.37%. Those two readings can coexist.
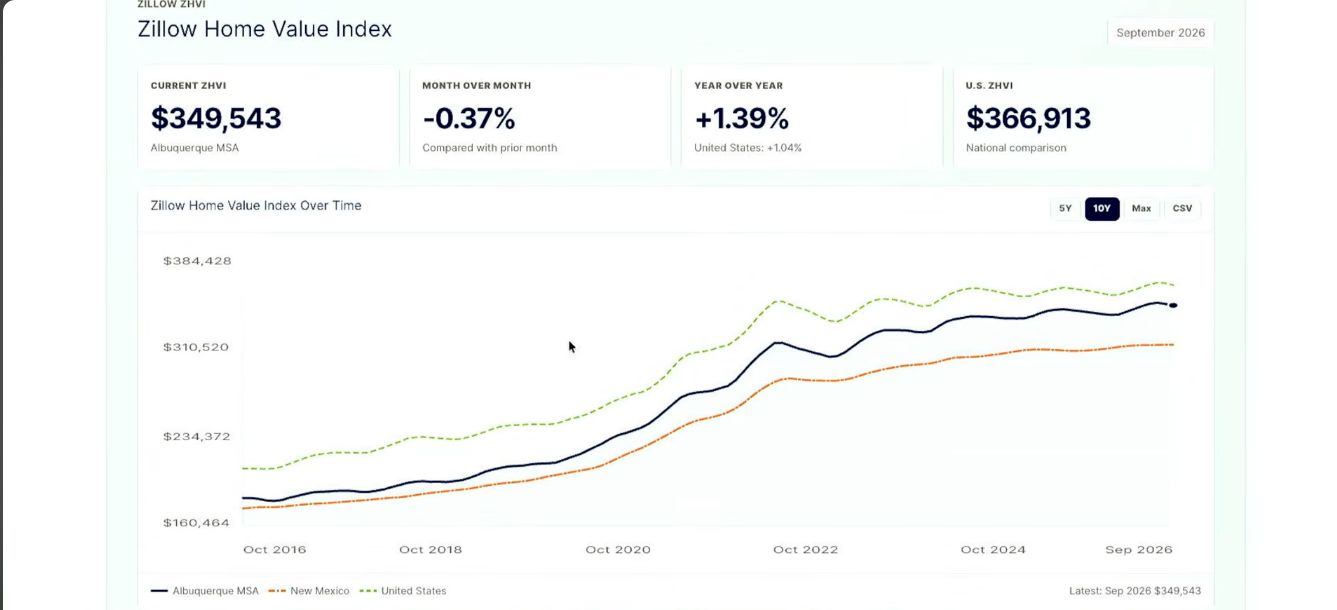
Zillow describes ZHVI as a measure of typical home values. It is a different lens from the median asking price of the homes currently for sale. Looking at both can be useful; combining them into one claim about every home would go too far.
The two homes shared in Episode 605
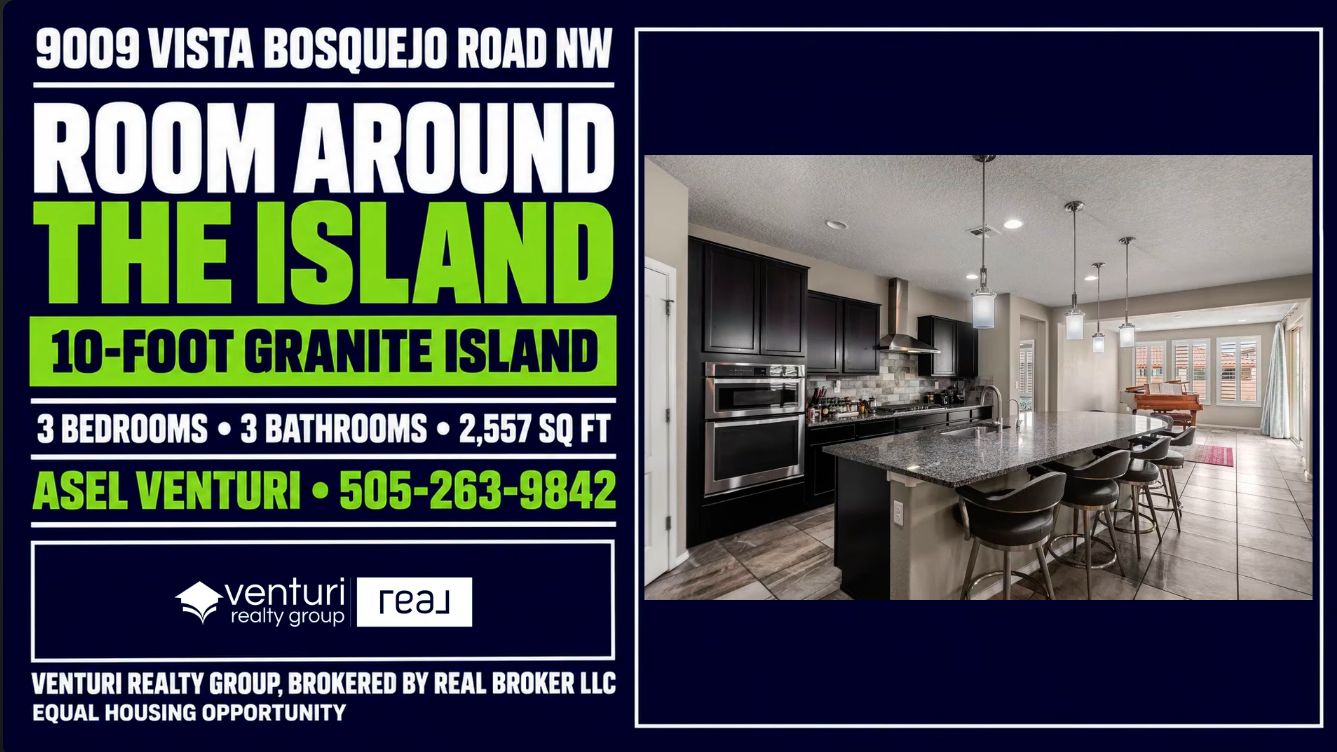
Tracy and Tego also tour two property stories on screen: 209 64th Street SW and 9009 Vista Bosquejo Road NW. They were discussed as coming-soon listings during the November 4 recording. The images below preserve those show moments, including historical prices or status visible on screen; the linked property pages are the place to check current details and availability.
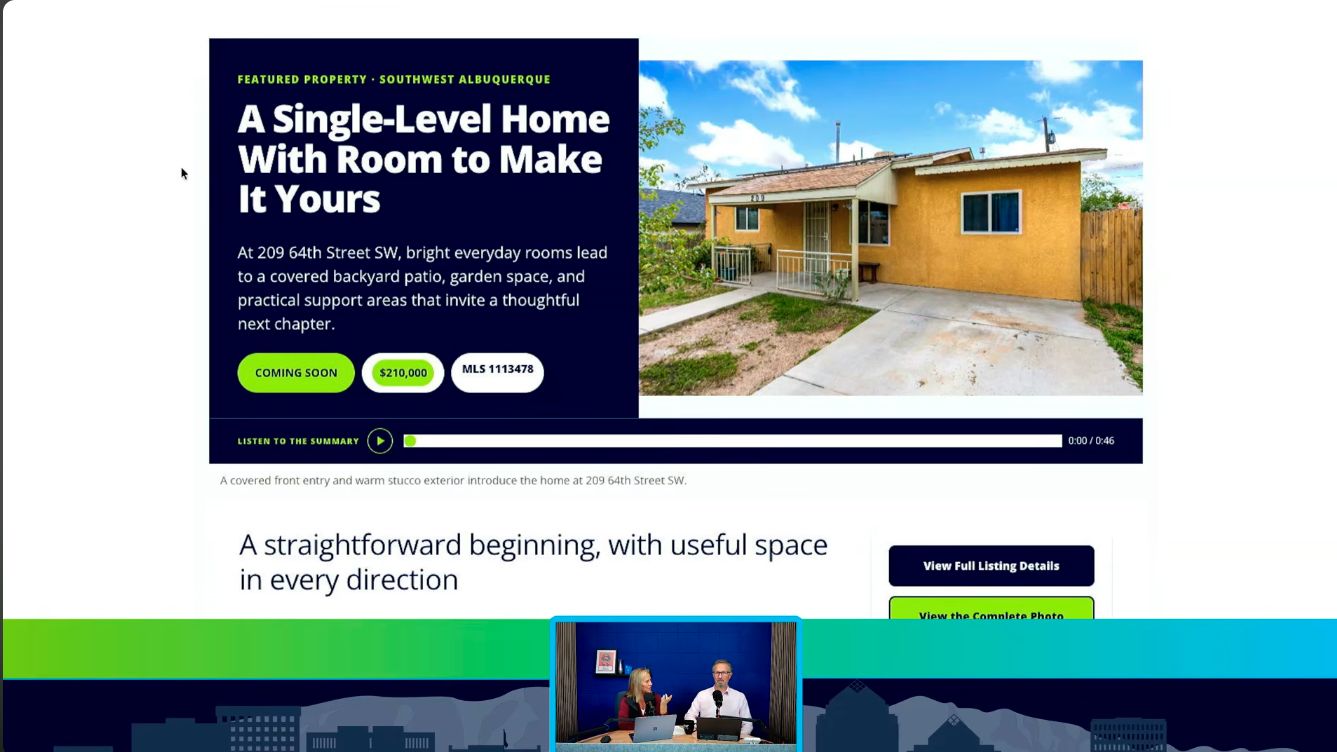
Later, Tracy returns to a practical seller takeaway: preparation often takes longer than people expect. Knowing the competition early leaves room to work on condition, photography, and timing before choosing a listing date.
Watch or listen to the full conversation
Watch Albuquerque Real Estate Talk, Episode 605 ↗ · Tracy and Tego Venturi · Recorded November 4, 2026.
Questions behind the comparison
Is Albuquerque a buyer’s market right now?
There is no single answer for every location and price range. Compare the latest dated local reports, then consider the available homes, recent comparable sales, condition, and your own goals. The tool above requests updated Altos reports rather than reusing the episode’s November 2026 numbers.
Does 6 months of supply mean a home will take 6 months to sell?
No. Months of supply measures available inventory relative to a defined pace of closed sales. Days on market and time to contract measure different things. None guarantees a particular home’s selling time.
Can I compare exact neighborhoods and the same dollar range here?
This version compares ZIP codes and Altos price quartiles, with the actual dollar spans displayed. It cannot reproduce an exact MLS area search between two price limits. Ask VRG for a matching neighborhood analysis when you need that level of detail.
Will a shared link still work when the market changes?
The link preserves your ZIP choices and price focus. When someone opens it, the tool requests the latest available reports and displays the source dates. A downloaded image remains a dated snapshot; include the tool link so the recipient can check for updates.
Sources and reading the dates
Episode screenshots and neighborhood figures come from the final Episode 605 video. The six-slide presentation is dated November 4, 2026. These historical examples remain fixed. The interactive comparison retrieves separate Altos single-family ZIP reports, updated on the provider’s weekly cadence.
VRG’s Altos market profiles · Current Southwest MLS monthly report · Zillow data definitions
The monthly MLS report, three-county episode searches, and Altos ZIP reports use different geographies, periods, and methods. Inventory snapshots, monthly averages, active listing time, and closed-sales pace should not be substituted for one another.
Bring the comparison down to your home
The tool can show how two ZIP codes differ. An exact neighborhood, price range, property type, and condition comparison can tell you much more about a particular buying or selling decision.
Venturi Realty Group, brokered by Real Broker LLC
Market data are dated and may be revised. This guide provides market context, not an appraisal, a forecast, or a guarantee of price, terms, or selling time. Verify current property details through the linked listing pages.