
Greater Albuquerque · September 2026 Market Report
Albuquerque Housing Market, September 2026: Prices Hold as Buyers Pull Back
Tego Venturi explains the gap between steady sale prices and slower activity—and the numbers buyers and sellers should look at next.
Tego’s market update · 10:52 Watch on YouTube ↗
How can Albuquerque home prices hold up when fewer people are buying? September’s housing numbers put that question squarely in front of buyers and sellers.
In his October 12 market update, Tego Venturi points to a detached-home median near $390,000 alongside a noticeable slowdown in sales, contracts, and recent showing activity. The distinction matters: a slower market can change the negotiation long before it produces a lower median sale price.
His explanation begins with two sides of the same market. Buyers face higher borrowing costs. Homeowners with favorable existing mortgages may have little reason to move. With activity restrained on both sides, prices and sales volume can move in different directions.
Watch Tego introduce the market’s central tension · 0:11 ↗
September 2026 Albuquerque housing market: the numbers
These figures cover detached homes across the Greater Albuquerque Southwest MLS market. Tego describes the area as Albuquerque and Rio Rancho, the East Mountains and Edgewood, and communities south to Belen. They are regional figures, rather than an Albuquerque city-only report or a forecast for a particular neighborhood.
| Metric | Sept. 2026 | Sept. 2025 | Year over year |
|---|---|---|---|
| Median sale price | $389,945 | $385,000 | +1.3% |
| Average sale price | $451,636 | $436,629 | +3.4% |
| Closed sales | 674 | 768 | −12.2% |
| New contracts / pending listings | 695 | 730 | −4.8% |
| Active listings | 2,331 | 2,320 | +0.5% |
| New listings | 862 | 876 | −1.6% |
| Months of inventory | 3.46 | 3.02 | +14.6% |
| Median days on market, sold homes | 20 | 22 | −9.1% |
Source: Venturi’s monthly Southwest MLS report, checked October 12, 2026. Tego rounds the median to $390,000 and supply to 3.5 months in the video. Pending figures can be revised as contract status changes.
A higher average doesn’t mean every home gained 3.4%
September’s $451,636 average sale price rose faster than the $389,945 median. Tego’s explanation is that higher-priced transactions can pull the average upward. It takes a look at the mix of sales to determine how much of that change reflects which homes sold.
The median marks the midpoint of the month’s sale prices; the average combines their total dollar value and divides by the number of sales. Neither follows the same individual home from one year to the next.
For a homeowner in Rio Rancho, the Northeast Heights, or the East Mountains, the useful follow-up is a comparison with similar nearby properties: size, condition, setting, and recent transaction terms. Applying a regional percentage to last year’s estimated home value skips that work.
The median asking price of pending detached homes was $379,900, up 1.3% from September 2025. Tego sees that as a possible sign of continued price support. It remains an asking-price measure for homes under contract; their final sale prices and closing outcomes are still ahead.
Watch Tego explain median and average prices · 2:58 ↗
Slower sales can increase supply without a flood of listings
September brought 674 detached-home closings, down from 768 a year earlier. New contracts also slowed, from 730 to 695. Yet active listings barely changed: 2,331 compared with 2,320.
New listings were slightly lower than a year earlier, too. The picture Tego describes is one of reduced movement through the market, with fewer incoming listings as well as fewer buyers completing purchases.
Months of inventory helps connect those numbers. Dividing 2,331 active listings by 674 monthly closings produces about 3.46 months. If sales slow while available listings stay similar, that ratio rises. It does not require a sudden wave of new sellers.
Tego connects the limited flow of new listings to the mortgage lock-in effect: owners with a favorable existing payment may choose to stay put when replacing that loan would cost more. That is his interpretation of seller behavior; the September counts alone don’t measure each homeowner’s motivation.
Watch the discussion of new listings and mortgage lock-in · 2:20 ↗
Selling at 98.6% of asking can still follow a price cut
A sale-to-list ratio of 98.6% sounds like sellers are giving up very little. Tego explains the missing detail: the comparison uses the list price at the time of contract, which may already be lower than the original asking price.
The monthly worksheet also reports a 96.7% sale-to-original-list-price ratio for detached homes. Those two market measures capture different parts of the pricing journey. They should not be added together or treated as a standard discount on every listing.
Consider a hypothetical home listed at $425,000, reduced to $400,000, and then sold for $394,400. It sold for 98.6% of the revised asking price, but roughly 92.8% of the original price. This example illustrates the arithmetic; it is not a reported Albuquerque transaction.
At about 4:34 in the update, Tego reports that roughly half of active MLS listings had reduced their asking price at least once. That is his snapshot at the time of the update. It does not mean homes lost half their value, or that a buyer should expect a 50% discount.
The monthly report separately lists an average active-listing price-change amount of approximately −5.4%. The share of listings with a reduction, the size of a reduction, and the eventual sale-to-list ratio answer three different questions. Keeping them separate makes the negotiation easier to understand.
Watch the sale-to-list and price-reduction explanation · 3:55 ↗
The 20-day median leaves unsold homes out of the picture
September’s detached-home median days on market was 20; the average was 39. Both describe listings that closed during the month. They do not tell us how long every home currently for sale has been waiting.
Tego emphasizes that these are backward-looking figures. Many September closings grew out of contracts negotiated earlier. A home still sitting on the market has not yet joined that closed-sale group.
That helps explain an apparent contradiction: the median for sold homes was shorter than a year earlier, even as Tego observed softer recent showing activity. Successful sales and current unsold inventory are different groups, measured at different moments.
When setting expectations for a specific property, compare its current competition and showing response with its own listing history. A metro median is useful context, but it is a poor substitute for asking why buyers are passing over this particular home.
Watch the explanation of backward-looking days on market · 5:42 ↗
Why Zillow’s county values differ from the MLS sale price
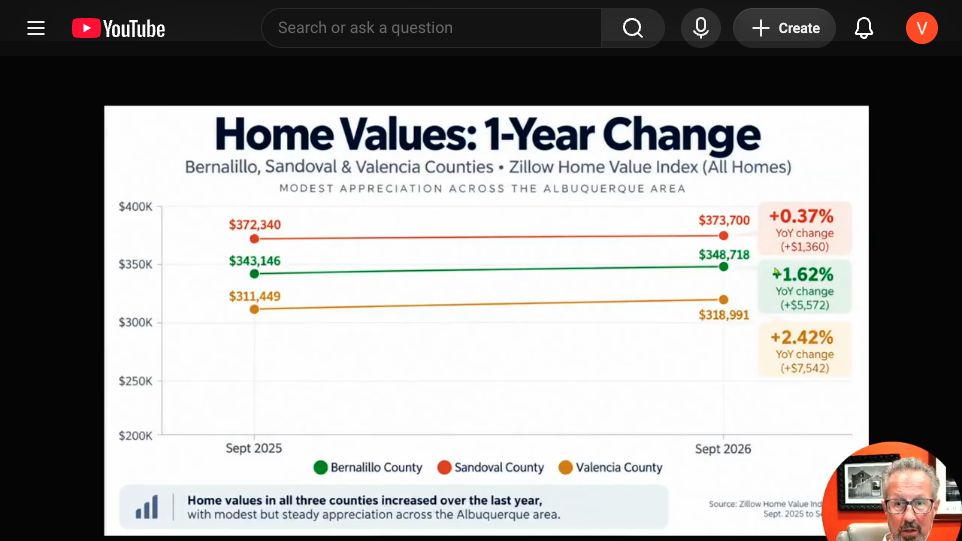
Later in the update, Tego switches to Zillow’s Home Value Index. Its figures are lower than the regional detached-home sale median, which can look confusing until the measurements are separated.
The MLS median describes homes that sold during September. Zillow’s Home Value Index estimates typical home value across a region and housing type, including homes that did not sell. Zillow defines the typical-value range as the 35th through 65th percentiles. The county chart in Tego’s update uses the all-homes series, adding another difference from the detached-home sales table.
| County | Typical value | Change from September 2025 |
|---|---|---|
| Sandoval | $373,700 | +0.37% |
| Bernalillo | $348,718 | +1.62% |
| Valencia | $318,991 | +2.42% |
All three counties show modest increases in the chart, with different levels and rates of change. These are the dated figures Tego presents, rather than a live valuation of any home. Zillow can revise its historical series.
Valencia’s lower typical value can be a starting point for a budget comparison. A purchase still depends on the actual property, financing, condition, insurance, taxes, and the travel the buyer expects to do. County-wide values cannot decide which home or location fits someone’s plans.
Watch Tego separate sale prices from county home values · 6:09 ↗
Mortgage rates can change affordability while prices barely move
Tego points to rising mortgage rates as a likely contributor to weaker buyer activity. The chronology supports taking that concern seriously, while leaving room for seasonality and other influences.
Mortgage News Daily’s October 9 report puts its top-tier 30-year fixed benchmark at 7.48%, compared with 6.75% at the end of August. Tego cites the 7.48% figure in his October 12 update. It is an October rate observation, not September’s average rate or a quote available to every borrower.
For a separate reference, Freddie Mac’s weekly survey averaged 7.40% for a 30-year fixed mortgage as of October 8. Different collection methods and dates produce different benchmarks. A lender’s offer also depends on the borrower, loan, points, and other terms.
Here is what the change from 6.75% to 7.48% looks like on an illustrative $390,000 purchase with 20% down: a $312,000 loan over 30 years.
The initial comparison adds about $154 a month in principal and interest—roughly 7.6%—without any change in purchase price. That is the practical affordability pressure behind Tego’s concern: a relatively small movement in the sale-price median can sit alongside a much larger change in borrowing cost.
For someone actively shopping, refresh the full monthly-payment estimate with a lender before relying on an earlier budget. Compare taxes, insurance, cash to close, and any association dues alongside the mortgage payment. A future refinance should not be necessary to make today’s purchase manageable.
Watch Tego connect mortgage rates and buyer activity · 8:02 ↗
Showings offer an earlier signal—with a seasonal catch
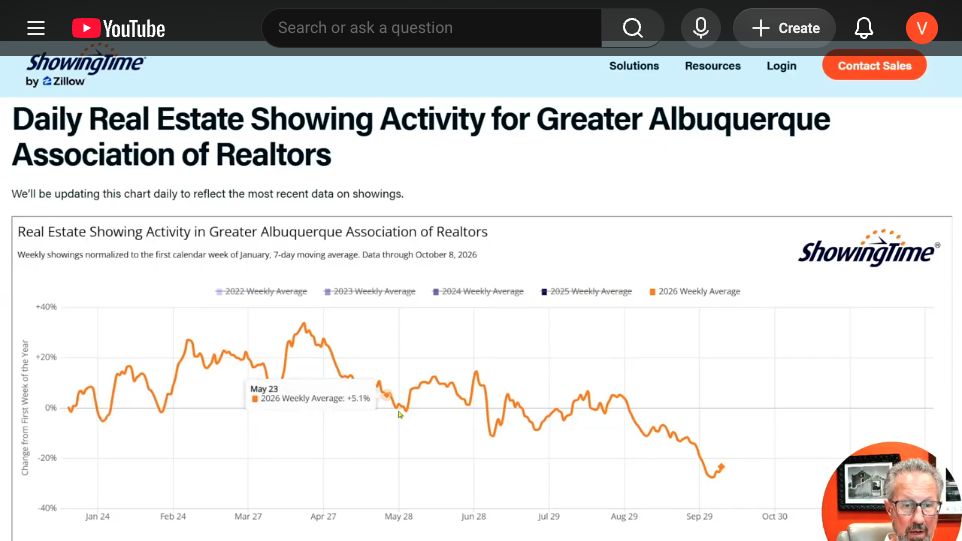
Near the end of the update, Tego shows a ShowingTime chart of Greater Albuquerque showing activity. The 2026 line falls during September, giving a more immediate view of buyer behavior than already-completed sales.
The chart’s baseline matters. Each year is measured against its own first week of January, using a seven-day moving average. A reading below zero means activity is below that year’s January baseline. It is not, by itself, a year-over-year decline of the same percentage.
Tego also notes that showings normally soften at this time of year. Rising rates and falling traffic occurring together suggest a relationship, but that chart alone cannot tell us how much came from financing costs and how much from normal seasonality.
The useful test is what happens next: whether showing activity stabilizes, new contracts recover, or the slowdown carries into later closings. Watch several weeks and compare the relevant price range, rather than treating one point on a chart as a market forecast.
Watch the showing-activity chart and its January baseline · 9:18 ↗
What this changes for an Albuquerque buyer or seller
Tego’s assessment is that the market feels closer to a buyer’s market than the inventory count alone might suggest. That is his judgment about current conditions. A supply ratio cannot tell us whether the owner of a particular home will negotiate.
A buyer can use the slower pace to investigate the property’s history: original price, reductions, time available, nearby alternatives, and likely repairs. Ask the lender to compare a lower purchase price with any proposed seller-paid closing costs or financing concession, subject to the loan’s rules. The best-looking discount may not produce the best overall purchase.
A seller has a different question: how does this home compete for a smaller pool of active buyers? Start with recent comparable sales and today’s competing listings, then watch showings, feedback, and offers. A rising regional average does not establish that an ambitious asking price will work.
If a home has already been reduced, evaluate what the change accomplished. Did it reach a different price bracket? Did showings increase? Do the photos, condition, and access give buyers a clear reason to consider it? Those answers are more useful than repeating that homes generally sell near asking price.
Homeowners who are staying put can treat this update as context for a later decision. Modest county-level appreciation and a steady regional median do not establish an individual equity position. A property-specific estimate and a current loan balance are the more useful starting points.
September’s lesson: price is only part of the market
The most useful conclusion from Tego’s update is that steady prices can coexist with a more difficult selling environment and tighter buying budgets. September’s detached-home median rose modestly, while fewer homes closed and fewer entered contract.
That combination calls for more detail in the decision: the home’s actual competition, its pricing history, the buyer’s current payment, and the strength of recent demand. Those details help explain what a broad headline leaves unresolved.
Questions about the Albuquerque housing market
Are Albuquerque home prices dropping in September 2026?
The Greater Albuquerque detached-home median sale price was $389,945, up 1.3% from September 2025. That regional sales measure does not establish how every individual home’s value changed. Price cuts on active listings are a separate measure.
How many homes sold in Greater Albuquerque in September 2026?
The monthly Southwest MLS worksheet reports 674 detached-home closings, compared with 768 a year earlier. Attached homes are reported separately and are not included in that total.
Does 3.46 months of inventory make Albuquerque a seller’s market?
The ratio alone cannot settle that question. It reflects available listings relative to the sales pace. Tego sees weaker buyer activity creating more negotiating room, but the individual property and competing options still matter.
Why do homes sell near asking price after a reduction?
The 98.6% sale-to-list ratio uses the asking price at the time of contract. An earlier reduction may already have lowered that price. The September detached-home sale-to-original-list ratio was 96.7%.
Is Zillow’s typical home value the same as the MLS median sale price?
No. Zillow’s index estimates typical value across a defined region and housing type, including homes that did not sell. The MLS median describes the midpoint of actual sales in a reporting period. Geography, property type, and methodology must match before comparing them.
Sources and reporting notes
Research checked October 12, 2026. The core MLS comparisons use September 2026 versus September 2025, detached homes, Greater Albuquerque. County values use the dated Zillow all-homes chart shown in the video. Mortgage-rate observations are dated separately. Figures can be revised.
Tego Venturi’s September 2026 market update, published October 12 supplies the interpretation, price-reduction snapshot, county chart, and showing observations. Exact-moment links throughout the article point to the published video.
Venturi’s monthly Southwest MLS housing report supplies the detailed September worksheet, including original-list-price comparisons. The weekly Albuquerque market tracker provides a separate view of active-market signals; weekly and monthly series should be compared within their own definitions.
Mortgage News Daily, October 9, 2026; Freddie Mac Primary Mortgage Market Survey, October 8, 2026; and Zillow Research data definitions provide the supporting rate and methodology context.
Payment figures and the hypothetical price-reduction example are our calculations. This report is general market education. An individual property’s value, loan terms, and transaction choices require a review of the specific circumstances.
Put the market in the context of your next move
Ask a Venturi broker to compare your home, price range, or buying budget with current local conditions.
Venturi Realty Group, brokered by Real Broker LLC.