Albuquerque Real Estate Market Update – November 2024
As we step into the first week of November 2024, it’s time to take a closer look at the Albuquerque real estate market. The data we’re analyzing comes directly from our multiple listing service. It provides an accurate snapshot of current trends. Let’s dive in and see what the numbers tell us about the residential housing market in Albuquerque.
Market Overview
This month, we’ll approach the data from a different angle by using a three-month rolling average. This means we’ll be looking at data from August, September, and October to better understand the changes in the market.
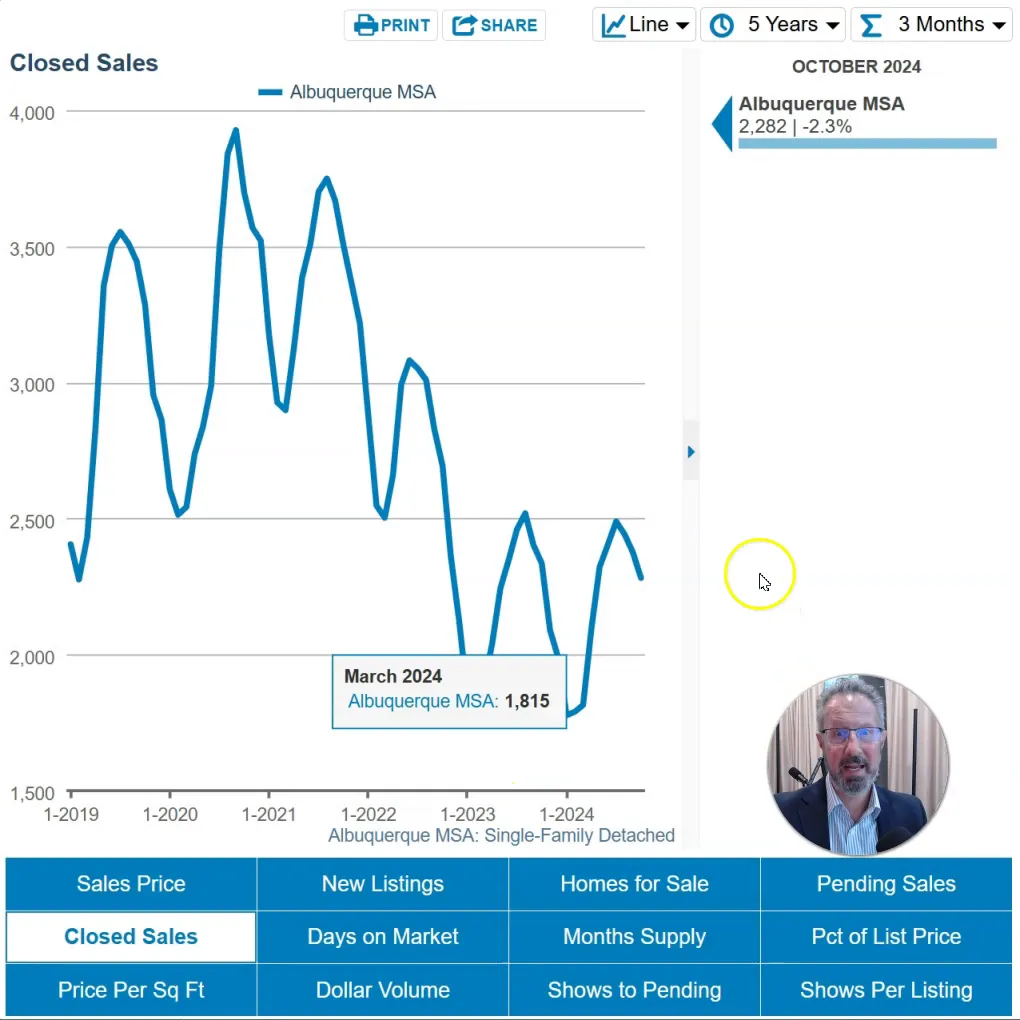
First up, let’s discuss closed sales. The data shows a decline of 2.3% in closed sales compared to the same three-month period last year. Overall, this indicates a slight decrease in activity, which is consistent with the ongoing trends we’ve been observing.
Yearly Comparisons
To provide a clearer context, let’s compare the current figures with previous years. Closed sales are down about 19% from 2022. Additionally, when we look back to October 2021, we see a staggering 38% decrease, and compared to 2019, which was the last ‘normal’ year in the market, we are down about 35% in sales.
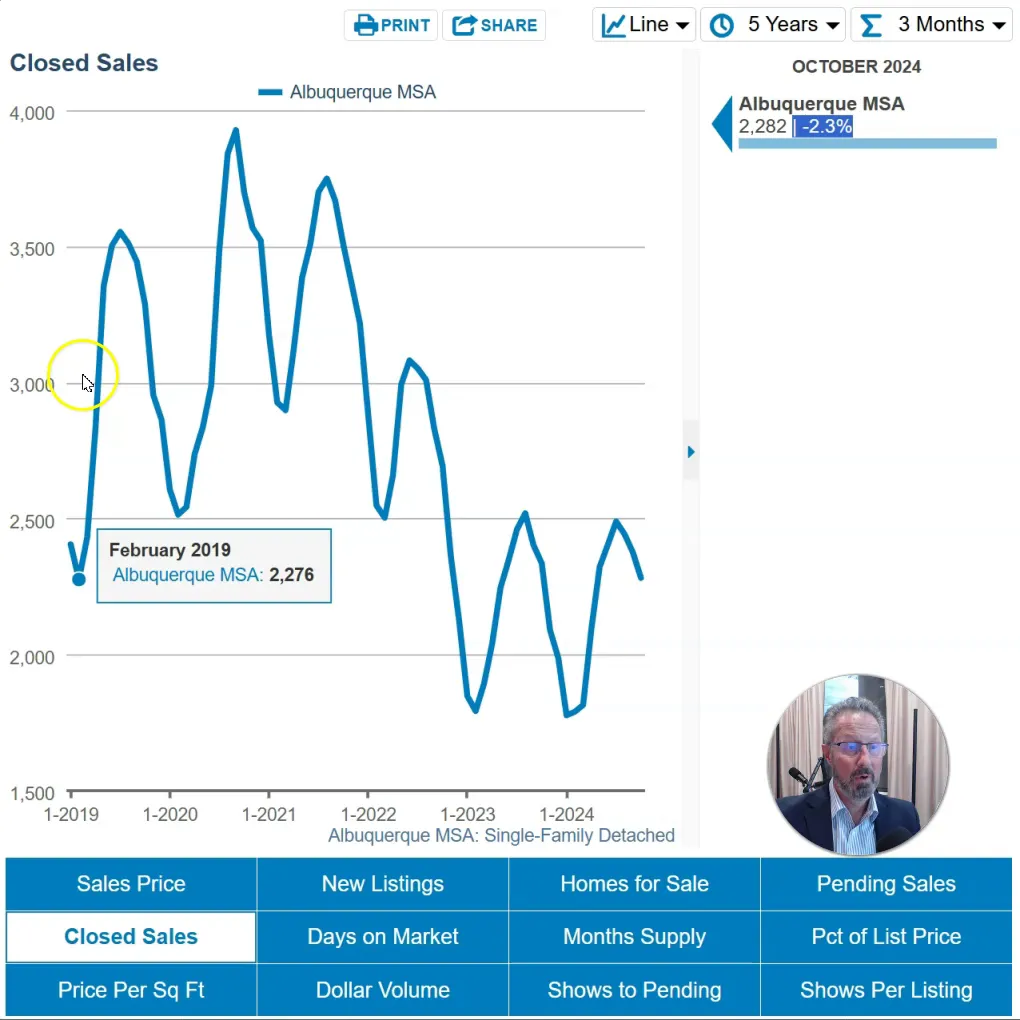
This consistent downward trend in the number of homes being sold suggests a slowing market, with demand continuing to lag. Now, let’s shift our focus to the supply side of the equation.
Homes for Sale
The number of Albuquerque area homes available for sale has reached a high not seen in recent years. While it’s still not back to pre-pandemic levels, the current inventory is significantly higher than what we’ve experienced over the past few years.
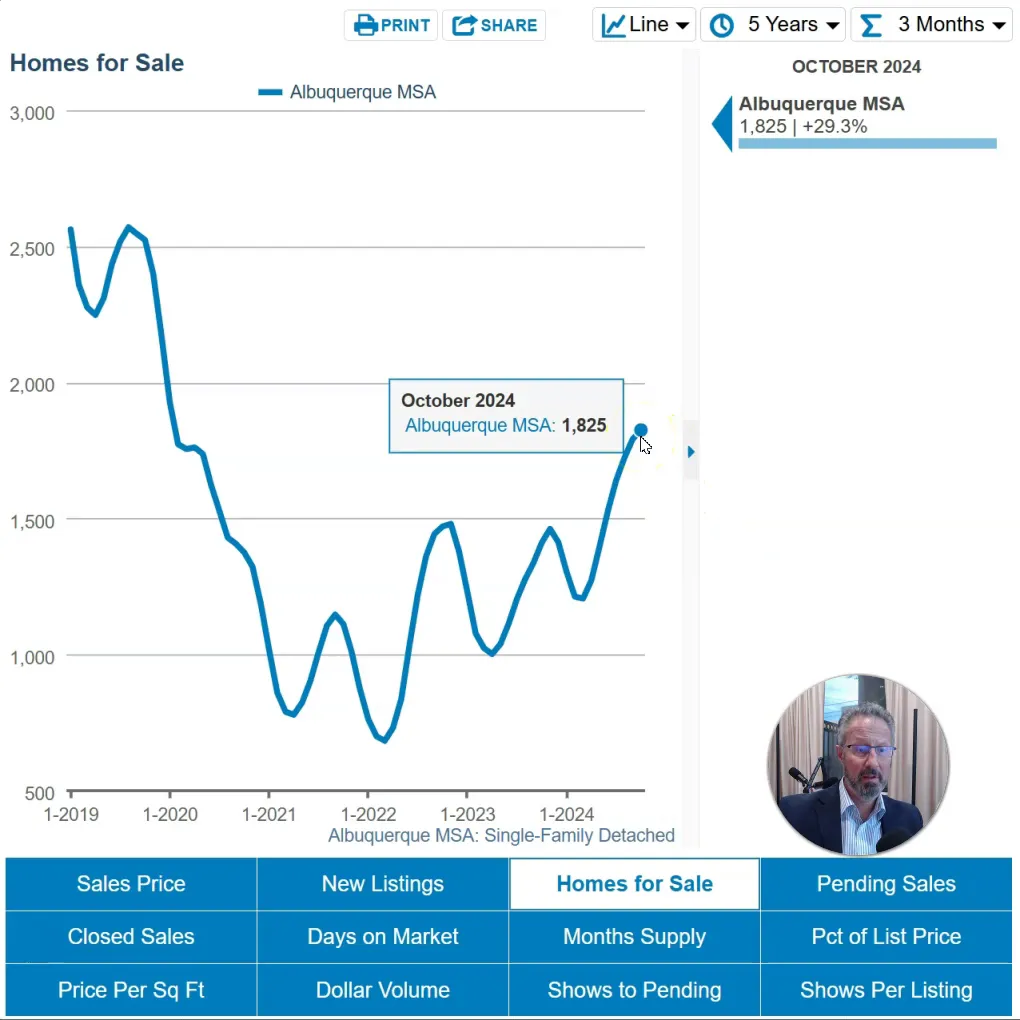
In fact, there are currently 29% more homes on the market compared to last year, and 34% more than in 2022. When we compare it to 2021, the increase is a remarkable 60%. However, even with these increases, we are still about 33% lower than the inventory levels seen in October 2019.
Market Dynamics
Despite the increase in inventory, the market remains tight. The number of homes coming on the market has been decreasing year over year. While there was a slight uptick of 3.5% in homes listed compared to last year, the overall trend indicates that fewer people are choosing to sell their homes.
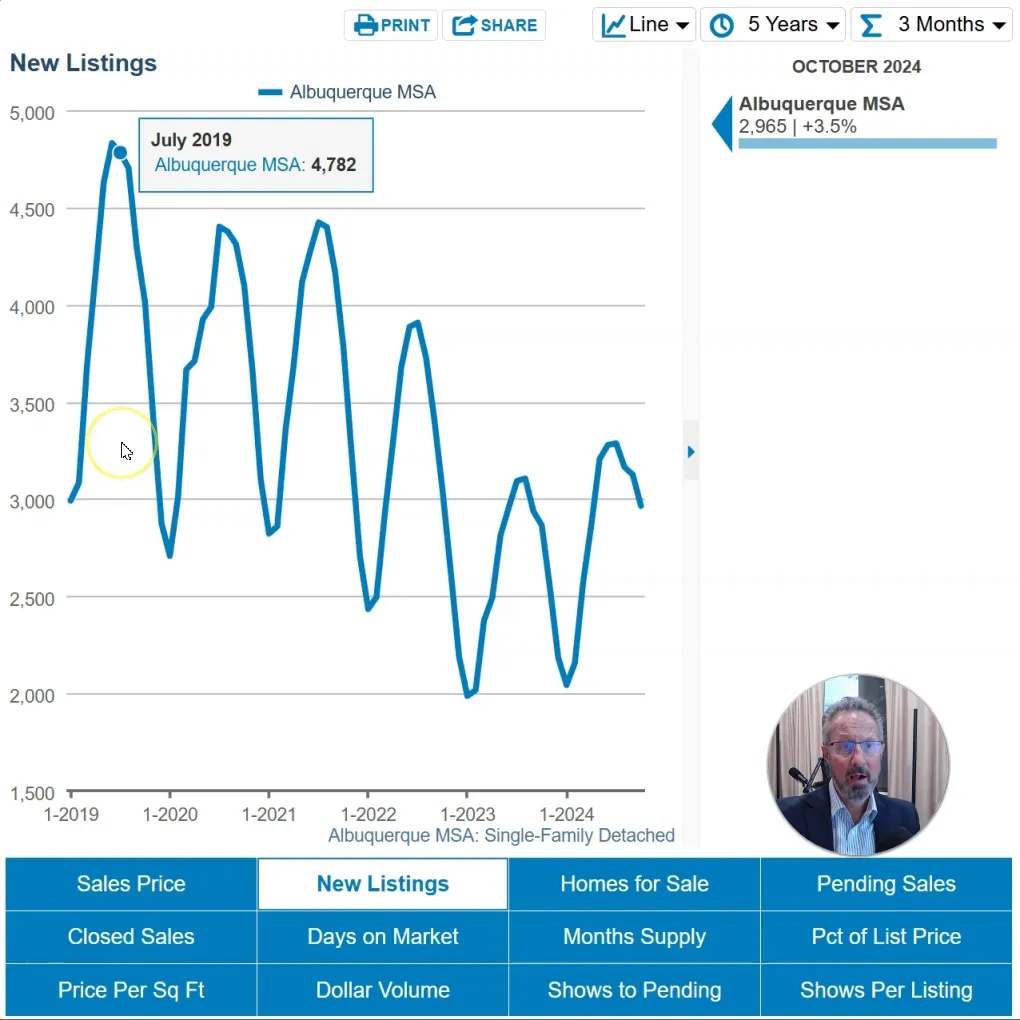
This phenomenon is often referred to as the “lock-in effect,” where homeowners with lower interest rates are less motivated to move, thus limiting the overall supply in the market.
Demand Insights
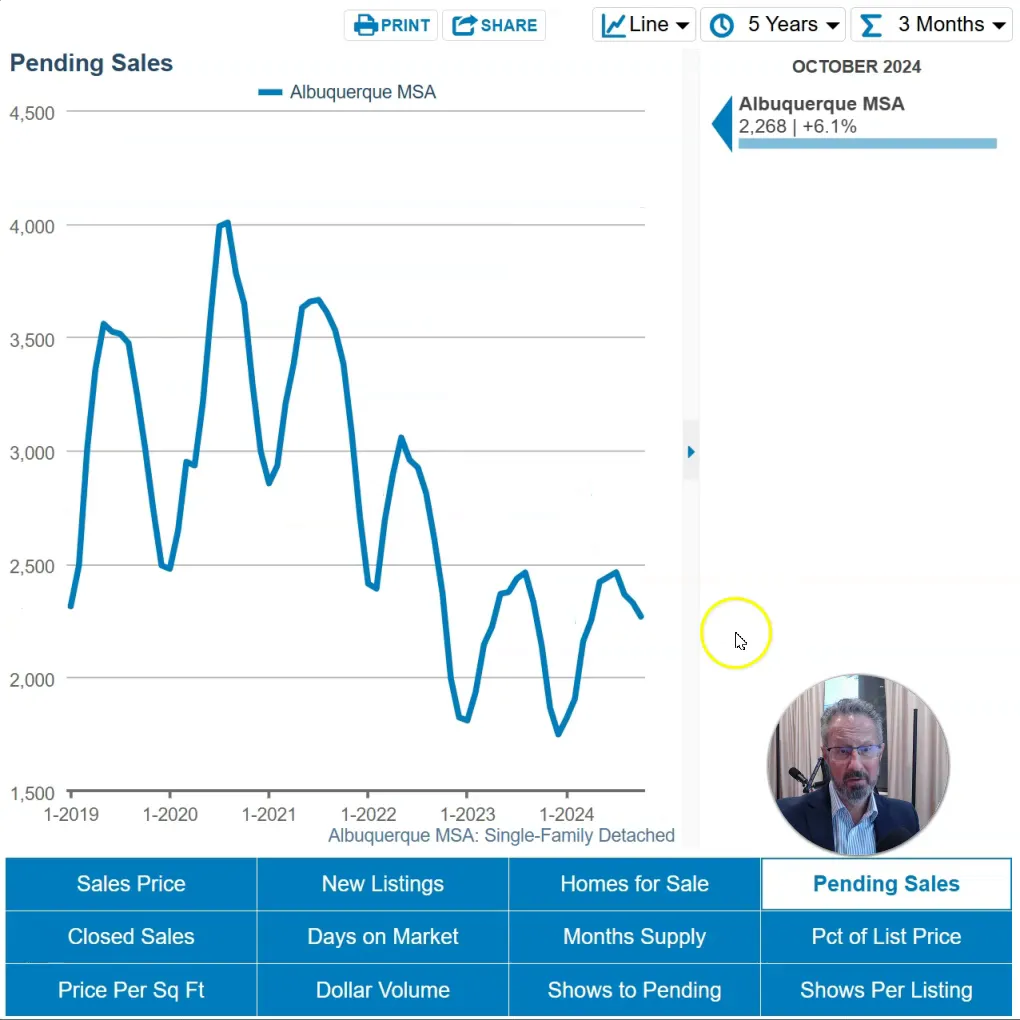
Now, let’s examine the demand side. We can look at pending sales as one of the key metrics. For October, pending sales are up by about 6% compared to the same period last year. This indicates that there are more buyers in the market, even if the overall feeling remains somewhat subdued.
Anecdotally, many real estate agents report that homes are taking longer to sell than they did during the peak market years. It seems that we are returning to a more normalized market, and the time on the market is aligning with pre-pandemic levels.
Foot Traffic Analysis
Interestingly, the number of showings per listing, which I like to refer to as “foot traffic,” has decreased from last year. This suggests that while pending sales are up, the number of people actively looking at homes has declined.
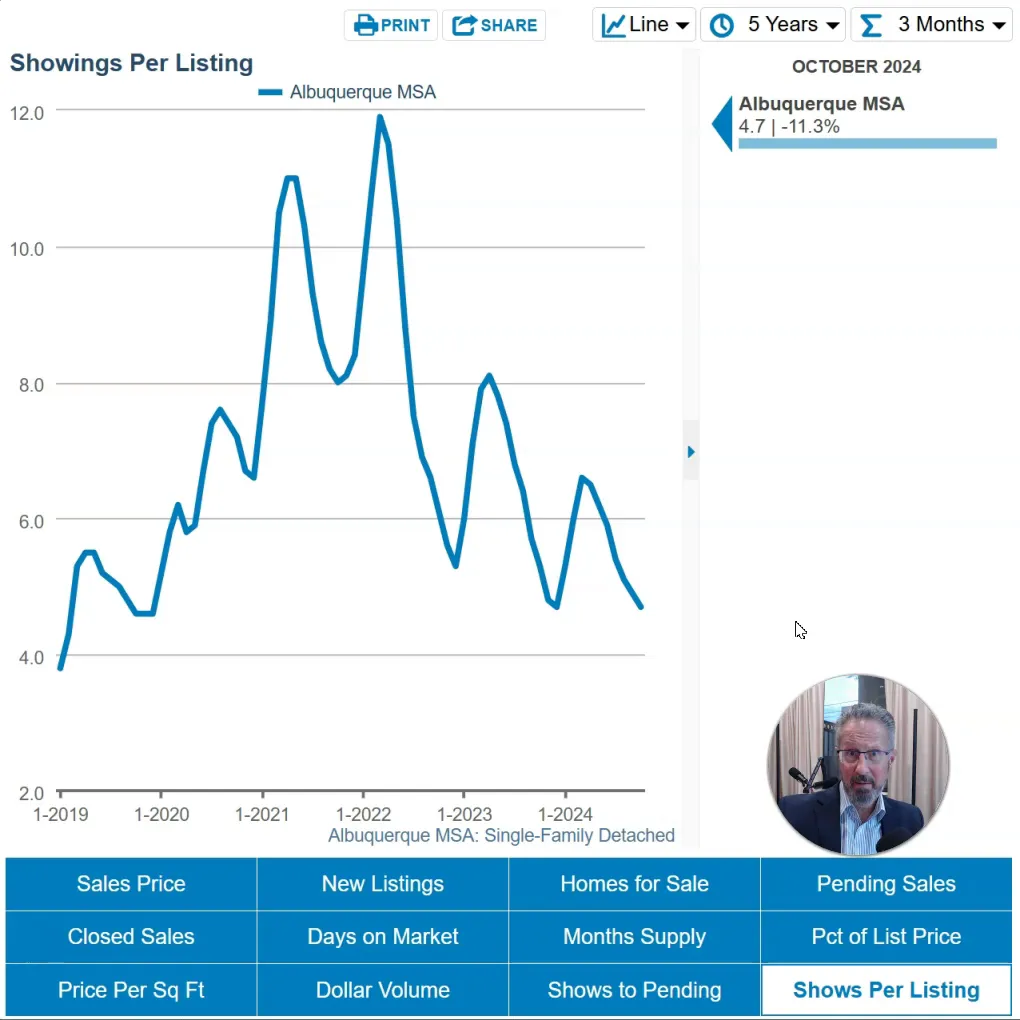
This indicates that the buyers who are out there are serious and ready to make a purchase, even though fewer people are viewing listings overall.
Price Metrics
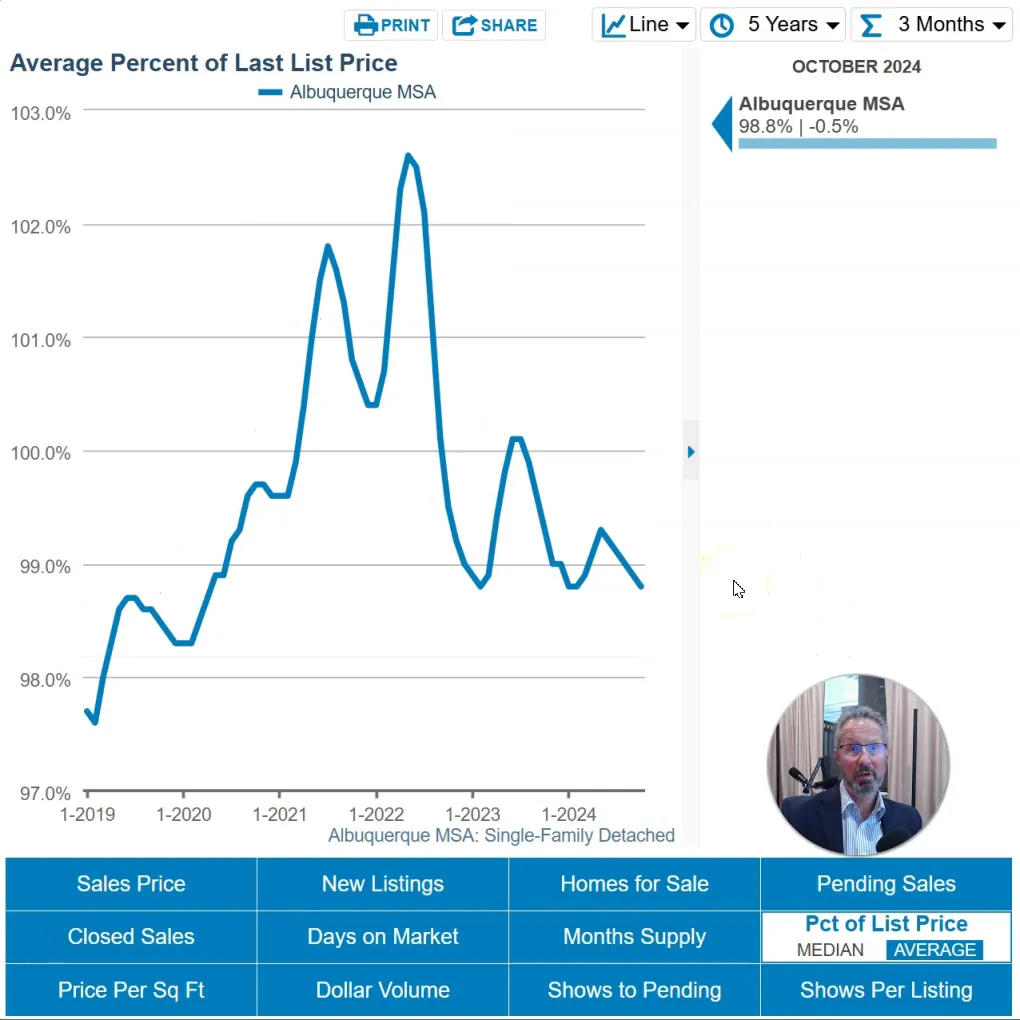
Next, let’s discuss the pricing metrics. The percent of the list price received for homes that closed recently is currently at 98.8%. This means that, on average, homes that sold over the last three months closed at 98.8% of their final list price, which is a slight drop from earlier periods when homes often sold above their listing price.
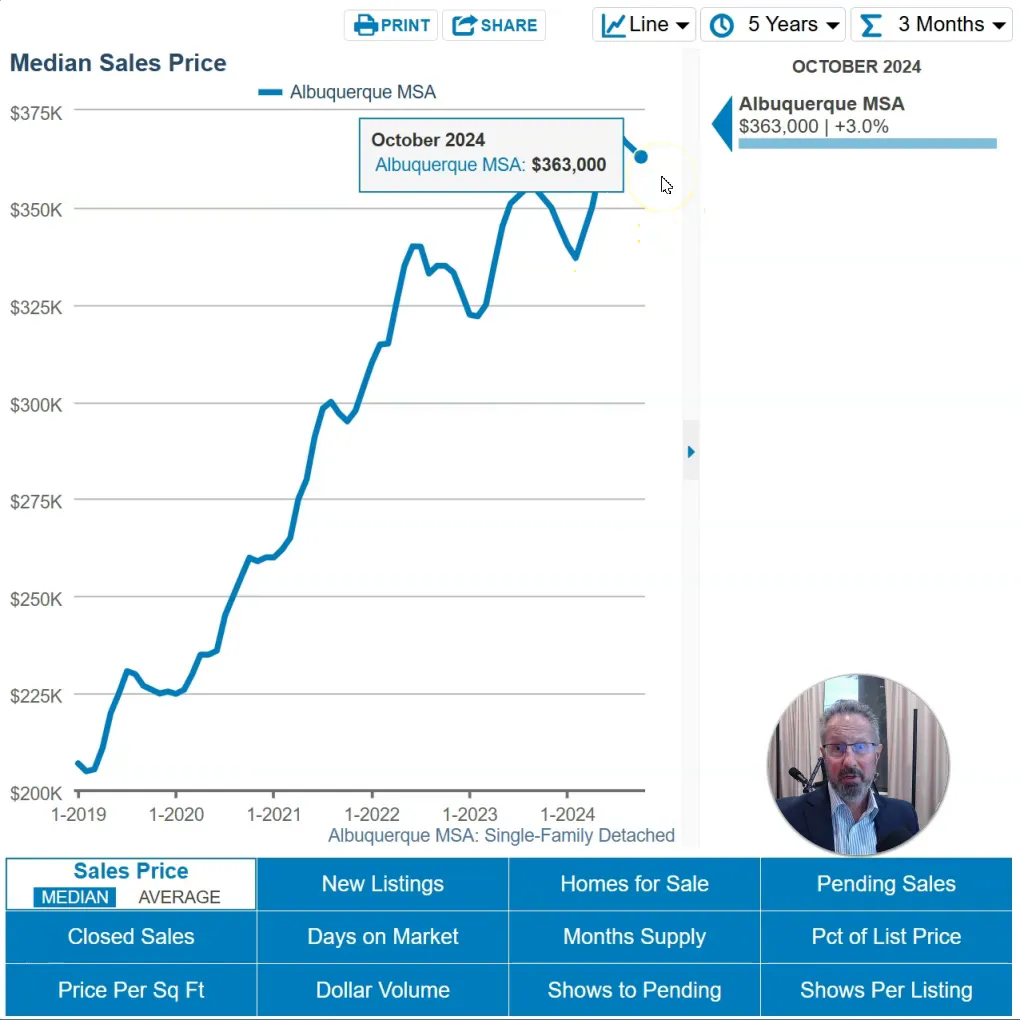
Moving on to sale prices, the median sale price for homes, using a three-month moving average, is $363,000, which is a 3% increase compared to last year. The average price stands at approximately $416,000, reflecting a modest increase of 1.5% year over year.
Price Appreciation
When we look at price per square foot, we see a similar trend with a median increase of around 3% from last year. This indicates that while the market is cooling, there is still slight price appreciation occurring, especially in more affordable neighborhoods.
Luxury homes, however, are not experiencing the same level of demand, which may affect their price growth differently. This variability highlights the importance of considering individual property characteristics rather than relying solely on broad market averages.
Future Pricing Trends
As we look forward, it’s crucial to consider where prices may be headed in the coming months. Currently, the median pending price for homes under contract is $375,000, which is a 7% increase compared to last year. This could indicate continued price appreciation into the end of the year and into early 2025.
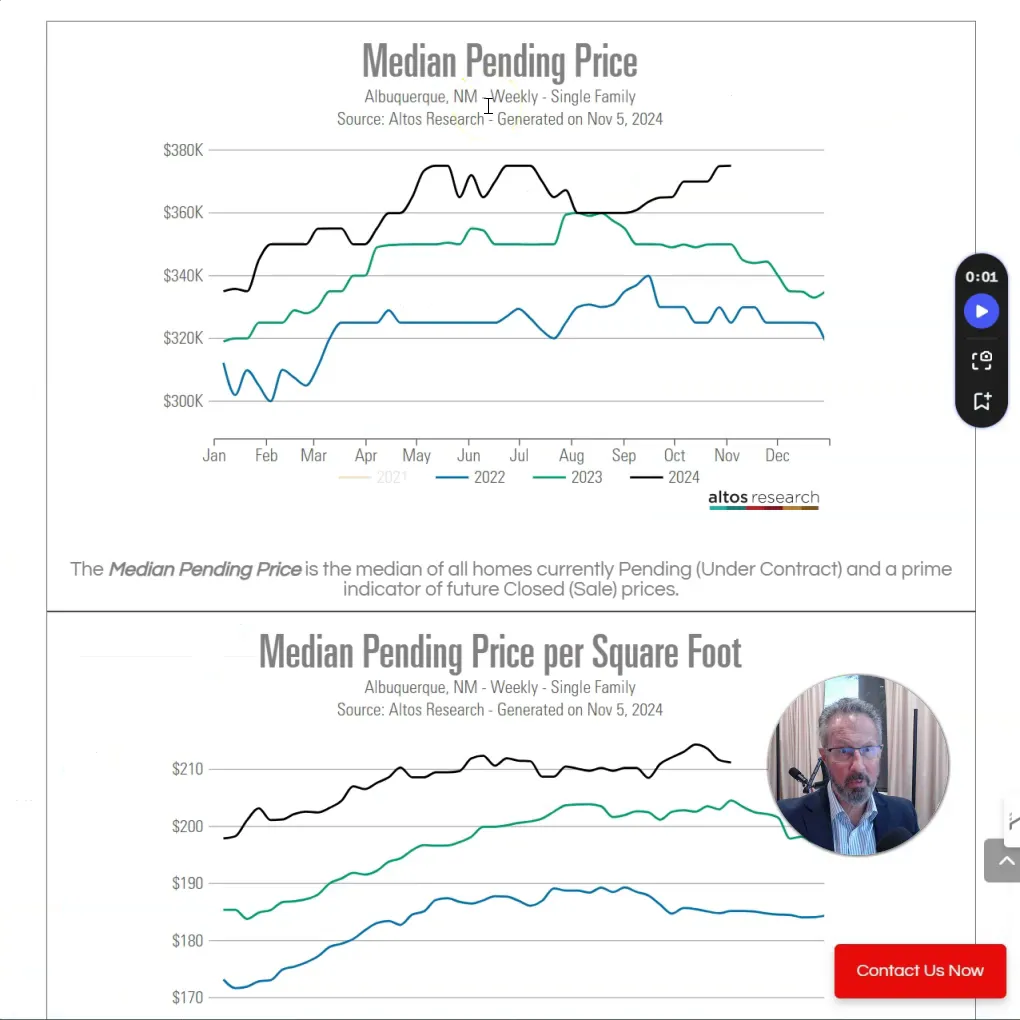
The average price per square foot for homes under contract also reflects a similar trend, suggesting a potential 3% gain in the near future. Overall, we can expect moderate price growth as we move into the holiday season.
Conclusion
In summary, the Albuquerque real estate market shows signs of a slowing pace with fewer closed sales and increased inventory. However, there are positive indicators such as rising pending sales and moderate price appreciation. For anyone navigating this market, it’s essential to stay informed and understand the nuances of local trends.
If you have any further questions regarding the Albuquerque real estate market, feel free to reach out to the Venturi Realty Group at 505-448-8888. We are here to help you navigate your real estate needs!
