Welcome to our look at the Albuquerque housing market for January 2024.
Tego walks us through the crucial insights into Albuquerque’s real estate market for the start of 2024.
National Insights: Predictions on Home Prices
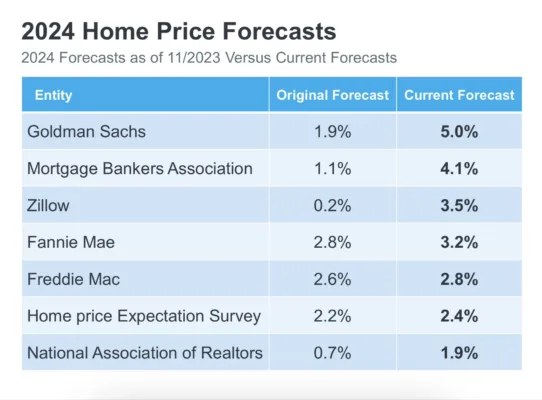
In national real estate, experts predict higher home prices in the upcoming year. These predictions come from credible sources. Goldman Sachs, Mortgage Bankers Association, Zillow, Fannie Mae, Freddie Mac, Home Price Expectation Survey, and the National Association of Realtors. These forecasts have moved up in the past few months.
National Insights: Mortgage Rate Trends
Mortgage rates have shown volatility, stabilizing at around 7% after a decline in December. Most economists anticipate a gradual mortgage rate decrease through 2024. However, predicting mortgage rates remains challenging as unexpected economic news can have a surprise impact.
Albuquerque Market – January 2024: Closed Sales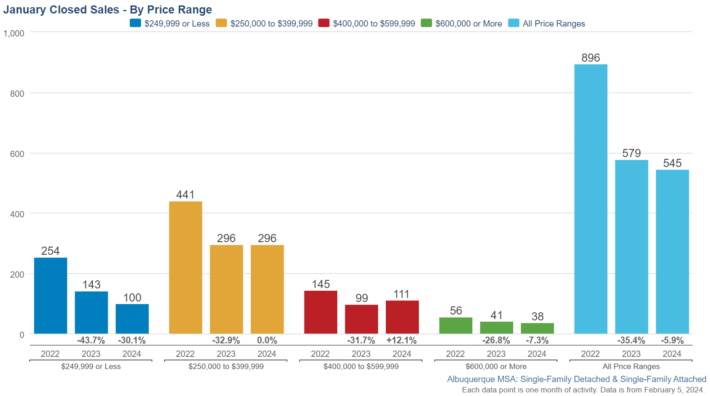
In Greater Albuquerque MSA, closed sales dipped by approximately 6%. The most significant decline was in the 250K and under price range. It’s essential to note that this lower-priced segment is shrinking within the market. Total closed sales in the Albuquerque Metro were 545 for Jan 2024. Slightly less than 2023, and ~40% less than 2022
Albuquerque Market – January 2024: Inventory Status
Inventory levels remained relatively stable compared to 2023 at 1,130. The 250K under category saw a significant 37% reduction. The 250K to 400K range experienced an increase, partially due to price appreciation. For perspective, January of 2019 had 2,597 properties on the market.
Albuquerque Market – January 2024: Positive Pending Sales
Pending sales were at 877 and had a 12% increase compared to 2023. This rebound follows a sluggish start in 2023, primarily attributed to higher mortgage rates.
Albuquerque Market – January 2024: New Listings
Newly listed homes offered limited relief to buyers. There were 835 new listings in January a modest increase in new listings compared to the previous 23.
Albuquerque Market – January 2024: Supply and Demand Ratio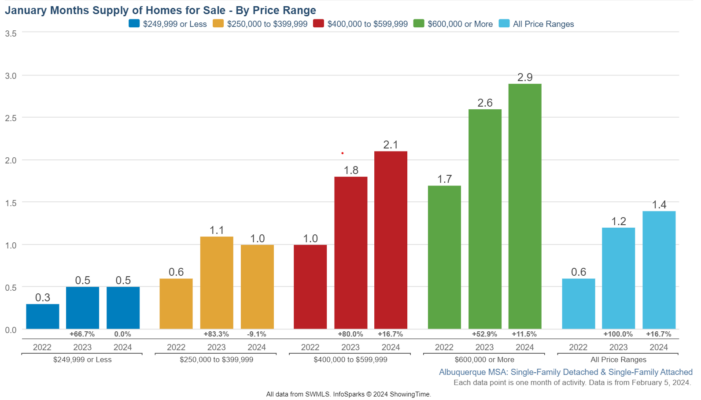
The supply and demand ratio, measured in months of supply, currently stands at 1.4 months. It remains notably low but varies significantly across different price ranges with under $250k at 1/2 month supply and over $600k at 3 months.
Albuquerque Market – January 2024: Days on Market
Median days on the market in January were 21 days, slightly higher than in recent years but still within historically low levels. For January of 2019, it was 32 days.
Albuquerque Market – January 2024: Showing Traffic
Showing traffic, based on lockbox data, experienced a slight decrease from the previous year, despite an increase in pending sales. On average homes had 6.8 showing in Jan.
Albuquerque Home Prices: Price per Square Foot
The median price per square foot stands at $200, a 9% increase compared to the previous year. However, prices in the higher market segments (over 600k) remained relatively stable, and lower price points saw a greater increase.
Albuquerque Home Prices: Median and Average Prices
Albuquerue’s Median and Average home prices had a 6.6% (median) and 3.9% (average) year-over-year (Jan vs Jan) increase. Tego estimates that based on this and other data, annual price appreciation in Albuquerque is in the 6-8% range at the moment.
Connect With Us
If you have questions or require advice on Albuquerque real estate, don’t hesitate to reach out to The Venturi Group of Real Broker at 505-448-8888. Let us help you navigate real estate. Thanks for joining us!
Full Video Transcript:
It is February 2024, and it is time to take a look at the Albuquerque housing market data for January 2024. I’ve got a couple national, pieces I want to show you here first, and then we’ll jump into the Albuquerque numbers And what is going on with the Albuquerque real estate market? Alright. It is by the way, it’s Tego Venturi, Venturi Realty Group, of Real Broker here in Albuquerque, and I’ve been doing these for years. And looking at market data way too much, I thing, but I I really would love to stay on top of it and share it with you.
2024 Home Price Forecast
So 2024 home price forecast, this is nationally. This just came up and it just was updated, and that’s the interesting thing about it. As you go through the list here, Goldman Sachs, Mortgage Bankers Association, Zillow, Fannie Mae, Freddie Mac, Home price expectation survey, that is a that’s a big picture where they survey 100 about a 100 different economists and then the NAR, National Association. And you can see everybody’s bumped up their forecast there.
Everybody’s expecting a little bit higher price appreciation this year as opposed to what they were thinking here a few months ago. And these are always changing, and, You know, you pretty much guarantee that these are gonna be inaccurate, but it gives you an idea of what the economists are feeling right now about the housing market nationally.
Mortgage Rates
The next piece of data I wanna jump on is the mortgage rates, because mortgage mortgage rates have a really big impact on what’s going on in the housing market in that that up forecast that we just saw, price appreciation forecast we just saw, has a lot to do with this right here.
So back well, you know, we go back to October or so of last year, And then we had a big drop in mortgage rates here back in the beginning of December, and then they were down a little bit, and then they dropped again here a few weeks ago. Now they’re back hovering around this 7%.
This is a 1 year chart, so you can kinda see the the ebbs and flow of this. Right now, mortgage rates are just under 7. Every week when there’s a different economic data that comes out, this might vary and change a little bit, but it gives you a sense of where Things were at most economists are projecting mortgage rates to go down through the year 2024, but That that’s a tough thing to project because there’s so many things that can impact mortgage rates.
Albuquerque Market Data for January
But right now, they’re they’re better than they’ve been, we can say that. Okay. So we’re gonna jump into the Albuquerque market data for January. We’re looking at January 2024. The number of sales. A look at supply, demand, days on market, as well as prices, and what is going on with home prices in Albuquerque. 1st and foremost, this is all single family detached and attached homes in the Greater Albuquerque area, all lumped together here. Greater Albuquerque, meaning the entire metro area.
And I’ve got this broken down by 4 different price ranges to give us some perspective. And so we have 250 and under, we have 250 to 4, 4 to 6, and 6 and above, and then the the big bars here on the far right of the screen are overall.
What we find is that closed sales are down about 5 well, 6% from last year. And you can see the greatest drop is in that 2.50 and under. We’re gonna find that a lot when we go here because The 2.50 and under price point is kinda going away, to be honest with you. There’s not a lot in that range, and you can see That lower middle, we’ll call it 250, pretty much equal with last year, and then that 4 to 6 actually had an increase. The higher end of the luxury market, let’s say, 6 and above, dropped a little bit, but it’s not a huge, huge move. Alright.
Inventory
Inventory, that’s always kind of the well, not always, but that’s been a big conversation lately, just a number of homes available.
It’s been very low over the year well. Really starting in 2019, and I’ll show you some perspective on that here in a second. But you can see the number home in the market if we look at overall exactly equal with last year, but above 2 years ago in 2022 when we were with the really, really low levels. You can see again back to this 250 and under, that dropped 37%, and we had an increase in the number of homes 4 to 6. A lot of that has to do just with price appreciation, more homes moving into that price range.
And I do wanna share with you and, oh, by the way, If you’re watching this on YouTube, please hit the subscribe button. It really would help me out just sharing this message on what’s going on in the Albuquerque housing market. And this is all on our website at welcome home a b q.com. In fact, these charts are just right off my website. I’m just doing a screen record of, our website.
Pending Sales
Pending sales, we saw some improvement there. So we saw 12% increase in the number of pending sales versus last year. Last Here at the beginning of the year, it was little little uncomfortable because mortgage rates were real really high. It was We had just come off that crazy 2 years, and it was relatively slow. So we’re pretty much equal back with 2022 pending sales.
And remember at the beginning of 22, it was still a very busy market until mid 22 when interest rates really, really spiked up. Alright. Newly listed homes on the market, not a whole lot of relief there for homebuyers. I mean, we are getting more, slightly more than last year, but still very limited number of homes coming on the market. I’m gonna run through some of these relatively quickly.
Months Supply
A month’s supply of inventory. This is our supply versus demand measurement ratio. We’re at 1.4 month supply, which is very low, still very low, but you can see across price ranges it’s very different.
So let’s just say that that 2.50 to 4 range, 1 month supply. Meaning, there’s 30 days worth of homes out there if everything just started kept selling at the same pace and nothing new came on. Under 2.50, no surprise, about 15 days. But then you get in the high end, it’s more like 3 months supply. So It really depends on what price range you’re in and what what the supply demand ratios are, of course.
Days on Market
Alright. Days on market, I’m gonna skip right to median days on market instead of average because this tells us, okay, half the homes sold in this many days, half of them sold for more than that many days. And in January, it was 21 days, which which is much higher than we’ve seen over the the last couple years.
However, that’s still very low historically just because we’re coming off of those crazy years of of 21 and and half of 22. And, Again, it’s all based on price range too. Homes that are more expensive stay in the market longer. Homes that are less expensive sell relatively quickly. Showing traffic.
Foot Traffic
This one, I I love it. It gives us an idea of how many people are actually seeing the homes. This is based on tracking how many times homes are shown based the lock boxes that we use. And it gives us a sense of just, you know, how many people out there looking. It’s actually down, which from last year, which is interesting because pendings were actually ups. Not sure what that means. I’m maybe it’s just that people are a little more not looking as at as many homes than they were last year and getting them under contract.
Albuquerque Home Prices for January
Alright. Everybody wants to know what’s going on with pricing. So we’re gonna look at median price per square foot. So this is of the home that sold, which is a nice measurement because it eliminates some of the square foot variations we get in overall median price.
Price per square foot, 200 a square foot. That’s 9% higher than last year. Last year was 5% higher than 22. You can see, though, in the higher price point, it’s pretty flat. Has well, it’s exactly the same number, 248 versus 248 a square foot. However, no surprise, you get net kind of middle middle price point, lower middle price point, 2.50 to 400, we saw a 9 a half percent increase in median price per square foot. If we look at it from an average standpoint, a little bit lower, it’s only 6% from last year.
Right now, Based on all the other data that I’m looking at as well as this, I I we’re we’re tracking somewhere around 6, seven, maybe 8% price appreciation across the board.
Again, that’s not 1 individual home. It’s just when you when you average it out everywhere, It appears to be that year over year price appreciation is somewhere in that 6 to 8% price range. And then finally, median price. Median price, all the homes that sold in January was 325,000, that is 6% higher than last year. And then in the the average price for January was 365,000, which is 4% higher than last year. Packed a lot in there as normal. If you’ve got any questions about real estate in Albuquerque, you can reach out to us. We are The Venturi Group of Real Broker.
Resources
Our number is (505) 448-8888. And, again, all of this is on our website at welcomehomeabq.com. Just look under market the market tab and monthly data, and you’ll see this whole chart that we just looked at right there.